Canada’s housing market improved for the 9th month in a row in November, with strong gains in both sales and price growth – a trend that’s expected to continue into 2020, according to the Canadian Real Estate Association.
The latest data reveals the number of homes trading hands nationwide rose 0.6% from October levels, and 11.3% from 2018. Meanwhile, the number of newly-listed homes continues to shrink, down -2.7%; that’s increasingly putting the squeeze on buyers and pushing more local markets into sellers’ conditions, which helped drive the national average sale price to $529,000, an increase of 8.4%. That indicates the market has recovered by 20% from the six-year low recorded this February, though it still lingers below the 2016 – 2017 peak by 6 – 7%.
The MLS Home Price Index, which measures the price benchmark for homes, also rose 0.8% month over month and 2.6% year over year.
Strong Housing Market Growth to Continue in New Year
It’s a dynamic housing market participants should get used to, as CREA has updated its forecast for this year and next, calling for sustained growth trends across the country over the long term; a total of 486,800 home sales are expected to be logged for 2019, up 6.2% from last year. Sales were stronger than expected in the second half of the year, while months of inventory continued to brush rock bottom (with the Prairies stripped out, there’s just a 0.1 month of supply of available homes for sale, a 15-year low). The average home price is expected to clock in at just over $500,000, up 2.3%.
CREA forecasts a total of 530,000 units will sell in 2020, an increase of 8.9%, while prices are expected to surge 6.2% to an average of $531,000.
It expects that the same regional price trends that defined the 2019 market to largely continue throughout the new year, namely uneven price growth between the west- and east-end provinces, overall slower performance in the Prairies, and Ontario and BC making up the bulk of activity.
Sales on the Rise in Most of Canada’s Major Markets
CREA reports that November home sales were up in nearly all of Canada’s major markets, with demand on the rise for British Columbia and the Greater Toronto MLS listings, which helped offset declines in Calgary.
According to CREA President Jason Stephen, markets that continue to struggle with sales volume are those that have been disproportionately affected by the OSFI federal mortgage stress test, which has had an overcorrecting effect in cities that had largely balanced or buyers’ conditions before it was implemented.
“Sales continue to improve in some regions and not so much in others. The mortgage stress test doesn’t help relieve the ongoing shortage of housing in markets where sales have improved, and it continues to hammer housing demand in markets with ample supply,” he states.
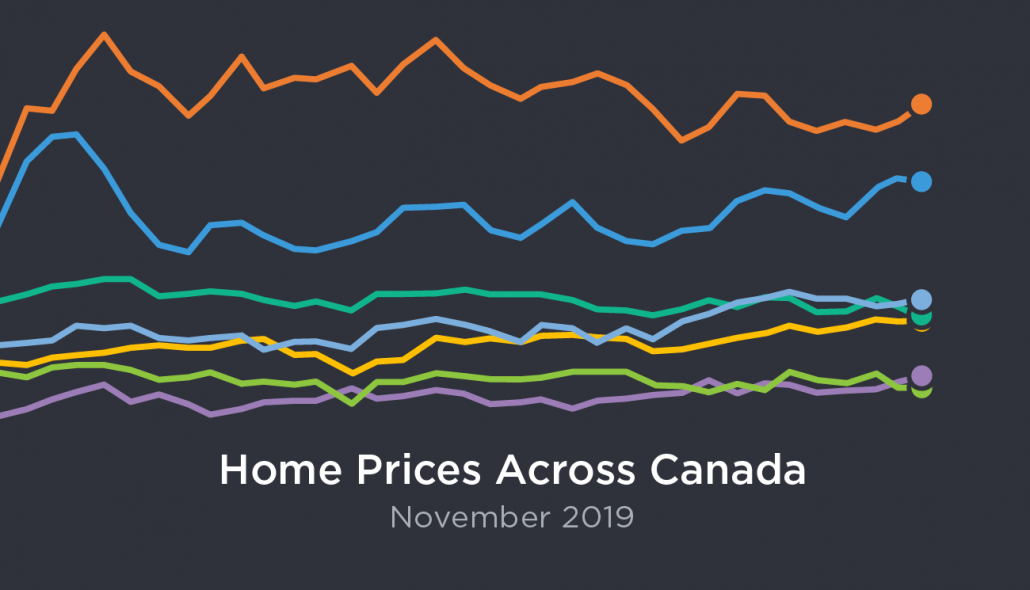
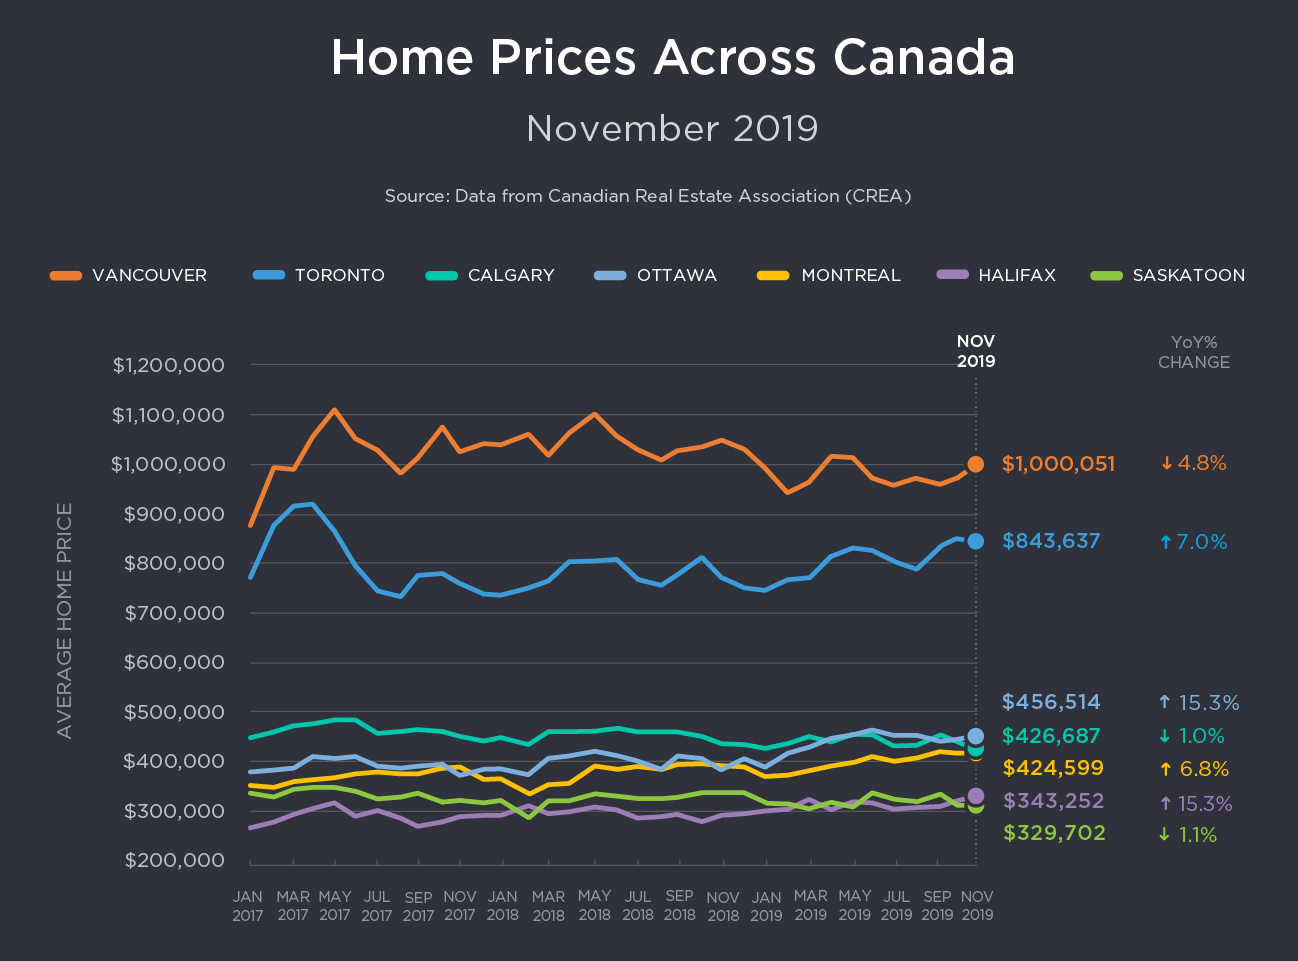
Check out how price growth differed in Canada’s major markets in the infographic below:
Supply-and-Demand Gaps Growing in Hottest Cities
As has been the long-term trend, uneven supply of housing across Canada is also contributing to mixed price growth, as some locales face a tight supply-and-demand crunch, while others sit on a plethora of available listings.
Gregory Klump, CREA’s chief economist, says that as long as these imbalances persist, prices will continue to grow in the nation’s largest cities.
“Home prices look set to continue rising in housing markets where sales are recovering amid an ongoing shortage of supply,” he says. “By the same token, home prices will likely continue trending lower in places where there’s a significant overhand of supply perpetuated in part by the B-20 mortgage stress test that continues to sideline home buyers there.”
As a result of higher sales volume and declining new listings on a monthly basis, the sales-to-new-listings ratio (SNLR) for Canada as a whole hit 66.3% in November – deep into sellers’ market territory, and well above the long-term average of 53.7%. This ratio, which measures the level of buyer competition in a market, is calculated by dividing the number of home sales by the number of new listings brought to market over the course of the month. A ratio between 40- 60% indicates a balanced market, with below and above that threshold signalling buyers’ and sellers’ conditions, respectively.
Conditions Uneven Between East and West
According to this measure, just over half of all local markets were balanced in November, with Alberta and Saskatoon remaining largely over supplied, with the opposite occurring in Ontario, BC, and the Maritimes.
The overall months of inventory – a measure of how long it would take to sell off all available homes for sale – sank to 4.2 months, the lowest it has been since the summer of 2007, and below the long-term average of 5.3 months. As has been the case, it remains higher than usual in the Prairies and Newfoundland and Labrador, while below typical levels in Ontario, Quebec, and eastern markets.
Overall, conditions remain balanced in BC, including on the Vancouver MLS, though CREA warns that markets within the province are primed for price growth and buyers rebound in solid numbers.
Price Gains by Province
BC: While year-over-year prices remain down in both Greater Vancouver and Fraser Valley, the pace of those declines is slowing, down -4.6% and -2.9%, respectively. However, the remainder of BC’s markets are on an uptick; prices rose 1.4% in the Okanagan, 1.5% in Victoria, and 2.9% elsewhere on Vancouver Island.
Prairies: Price growth remains subdued across the board, down -2% in the Edmonton, Saskatoon, and Calgary real estate markets, while falling -5.5% in Regina.
Ontario and Eastern Canada: According to CREA, “… price growth has re-accelerated well ahead of overall consumer price inflation across most of the GGH. Meanwhile, price growth in recent years has continued uninterrupted in Ottawa, Montreal, and Moncton.”


 Maziar Moini, Broker of Record - Home Leader Realty Inc.
300 Richmond St. W., #300, Toronto, ON M5V-1X2
Maziar Moini, Broker of Record - Home Leader Realty Inc.
300 Richmond St. W., #300, Toronto, ON M5V-1X2