Toronto’s low-income renters may soon get some relief from the city’s overheated market following the announcement of a $1.4-billion rental housing benefit co-funded and agreed on by the provincial and the federal governments.

Housing Minister Steve Clark said he expects the Canada-Ontario Housing Benefit, which eligible participants can use wherever they decide to rent, will support roughly 5,200 households provincewide during the first year of the program and that number will increase annually. He made the comments following a Thursday morning press conference announcing that Ontario would be the first province to start the rollout of the national program.

Clark said households can expect to receive on average about $575 per month, although more precise details are expected to be negotiated based on city size and needs identified by service providers. In terms of program expansion, Clark said “this is something we are going to take our time with as we roll it out.”

The minister’s office later confirmed to the Star that Toronto is expected to receive about $7.5 million over 2020 and 2021, just the start of a program expected to continue for about an additional seven years.

Mayor John Tory described the announcement as “another great example of how governments are working together” to help residents in need, in a statement released before he spoke at the conference. “Making sure people have access to affordable housing is a top priority for me as mayor and that requires the co-operation and support of other levels of government.”

The national rent program is expected to help at least 300,000 low-income renters across Canada, over seven years, as part of the National Housing Strategy, and is valued at $4 billion, once provincial and territorial cost matching is factored in. Exactly how the $1.4 billion will be divided across the province has yet to be worked out.

Priority will be given to households eligible for or on a “social housing waiting list and households in financial need living in community housing. This includes survivors of domestic violence and human trafficking, persons experiencing or at risk of homelessness, Indigenous persons, seniors and people with disabilities,” a government release states.

Asked how this will be worked out, as some cities, like Toronto, are facing higher costs than others, Clark spoke to the accepted calculation that affordable housing is about 80 per cent of what is considered average market rent and that no household should be paying more than 30 per cent of income to cover those costs.

While the National Strategy has been publicized as being worth as much as $55 billion, Ontario’s Office of the Parliamentary Budget Officer determined the actual federal dollars pledged represented a “nominal” increase in spending on housing once current spending and the winding down of existing housing programs are factored in, as outlined in a June 2019 report.

For the national benefit to work, the federal government is operating on the assumption provinces and territories will kick in their portions of the money for the length of the program, according to the report, and “it is still not clear this would require a meaningful increase in spending as, for example, social assistance payments could be reclassified as matching funding.”

The active wait-list for subsidized housing across Toronto was counted at more than 102,000 households during the first quarter of 2019. More than a third were identified as seniors, according to numbers posted on the city’s website.

Thursday’s announcement was made in front of a Toronto Community Housing building at 150 River St., near Dundas Street East, and part of the newly revitalized sections of the Regent Park neighbourhood. That building contains 125 rent-geared-to-income units and 33 units of what is defined as affordable housing and whose residents were chosen through a lottery-like system, said TCH spokesperson Bruce Malloch.

People who wanted to live in those affordable units, two- and three-bedroom apartments costing $1,194 and $1,331 respectively, submitted their names into a random draw and if selected their applications were considered.

The maximum household income for the two-bedroom units was $57,312, and $63,888 for three-bedroom units.

Malloch said more than 1,800 applications were made for the two-bedroom units and more than 1,600 applications for the three-bedroom apartments. Residents are starting to move in this week.

What constitutes affordable housing is typically based around numbers reported by the Canada Mortgage and Housing Corp., which tracks what people are paying for occupied purpose-built rental units. Condominiums are considered a separate category and are not included.

Housing is considered affordable if it matches or is lesser than the average of those occupied purpose-built rentals, which are subject to rent control. In Toronto, landlords can charge whatever they want for empty units, and any units occupied after mid-November 2018 have no rent controls at all.

Across Old Toronto, the average cost for a two-bedroom apartment in 2018 was $1,829 and a three bedroom was $2,473, according to the most recent CMHC rental market housing report for the Greater Toronto Area.

Research firm Urbanation reported that average rents for newly leased or available purpose-built rental units was about $2,515 per month, in an October news release. The release did not include unit size.

Correction — Dec. 19, 2019: The benefit is expected to help 300,000 low-income renters across Canada. A previous version of this story said the number would assist 300,000 people across Ontario.


Canada’s housing market improved for the 9th month in a row in November, with strong gains in both sales and price growth – a trend that’s expected to continue into 2020, according to the Canadian Real Estate Association.

The latest data reveals the number of homes trading hands nationwide rose 0.6% from October levels, and 11.3% from 2018. Meanwhile, the number of newly-listed homes continues to shrink, down -2.7%; that’s increasingly putting the squeeze on buyers and pushing more local markets into sellers’ conditions, which helped drive the national average sale price to $529,000, an increase of 8.4%. That indicates the market has recovered by 20% from the six-year low recorded this February, though it still lingers below the 2016 – 2017 peak by 6 – 7%.

The MLS Home Price Index, which measures the price benchmark for homes, also rose 0.8% month over month and 2.6% year over year.

Strong Housing Market Growth to Continue in New Year
It’s a dynamic housing market participants should get used to, as CREA has updated its forecast for this year and next, calling for sustained growth trends across the country over the long term; a total of 486,800 home sales are expected to be logged for 2019, up 6.2% from last year. Sales were stronger than expected in the second half of the year, while months of inventory continued to brush rock bottom (with the Prairies stripped out, there’s just a 0.1 month of supply of available homes for sale, a 15-year low). The average home price is expected to clock in at just over $500,000, up 2.3%.

CREA forecasts a total of 530,000 units will sell in 2020, an increase of 8.9%, while prices are expected to surge 6.2% to an average of $531,000.

It expects that the same regional price trends that defined the 2019 market to largely continue throughout the new year, namely uneven price growth between the west- and east-end provinces, overall slower performance in the Prairies, and Ontario and BC making up the bulk of activity.

Sales on the Rise in Most of Canada’s Major Markets
CREA reports that November home sales were up in nearly all of Canada’s major markets, with demand on the rise for British Columbia and the Greater Toronto MLS listings, which helped offset declines in Calgary.

According to CREA President Jason Stephen, markets that continue to struggle with sales volume are those that have been disproportionately affected by the OSFI federal mortgage stress test, which has had an overcorrecting effect in cities that had largely balanced or buyers’ conditions before it was implemented.

“Sales continue to improve in some regions and not so much in others. The mortgage stress test doesn’t help relieve the ongoing shortage of housing in markets where sales have improved, and it continues to hammer housing demand in markets with ample supply,” he states.

Check out how price growth differed in Canada’s major markets in the infographic below:


Supply-and-Demand Gaps Growing in Hottest Cities
As has been the long-term trend, uneven supply of housing across Canada is also contributing to mixed price growth, as some locales face a tight supply-and-demand crunch, while others sit on a plethora of available listings.

Gregory Klump, CREA’s chief economist, says that as long as these imbalances persist, prices will continue to grow in the nation’s largest cities.

“Home prices look set to continue rising in housing markets where sales are recovering amid an ongoing shortage of supply,” he says. “By the same token, home prices will likely continue trending lower in places where there’s a significant overhand of supply perpetuated in part by the B-20 mortgage stress test that continues to sideline home buyers there.”

As a result of higher sales volume and declining new listings on a monthly basis, the sales-to-new-listings ratio (SNLR) for Canada as a whole hit 66.3% in November – deep into sellers’ market territory, and well above the long-term average of 53.7%. This ratio, which measures the level of buyer competition in a market, is calculated by dividing the number of home sales by the number of new listings brought to market over the course of the month. A ratio between 40- 60% indicates a balanced market, with below and above that threshold signalling buyers’ and sellers’ conditions, respectively.

Conditions Uneven Between East and West
According to this measure, just over half of all local markets were balanced in November, with Alberta and Saskatoon remaining largely over supplied, with the opposite occurring in Ontario, BC, and the Maritimes.

The overall months of inventory – a measure of how long it would take to sell off all available homes for sale – sank to 4.2 months, the lowest it has been since the summer of 2007, and below the long-term average of 5.3 months. As has been the case, it remains higher than usual in the Prairies and Newfoundland and Labrador, while below typical levels in Ontario, Quebec, and eastern markets.

Overall, conditions remain balanced in BC, including on the Vancouver MLS, though CREA warns that markets within the province are primed for price growth and buyers rebound in solid numbers.

Price Gains by Province
BC: While year-over-year prices remain down in both Greater Vancouver and Fraser Valley, the pace of those declines is slowing, down -4.6% and -2.9%, respectively. However, the remainder of BC’s markets are on an uptick; prices rose 1.4% in the Okanagan, 1.5% in Victoria, and 2.9% elsewhere on Vancouver Island.

Prairies: Price growth remains subdued across the board, down -2% in the Edmonton, Saskatoon, and Calgary real estate markets, while falling -5.5% in Regina.

Ontario and Eastern Canada: According to CREA, “… price growth has re-accelerated well ahead of overall consumer price inflation across most of the GGH. Meanwhile, price growth in recent years has continued uninterrupted in Ottawa, Montreal, and Moncton.”

Global household wealth is currently estimated at about $360 trillion, according to Credit Suisse’s 2019 Global Wealth Report. This represents an increase of about $9 trillion (~2.6%) from 2018-2019.

Over the last decade, much of this growth in household wealth has come from two countries: the United States and China. 40% of the world’s US dollar millionaires reside in the United States, and China now has the second highest number of dollar millionaires. (If there are any curious Canadians reading this, Canada represents 3% of the world’s total.)

The number of ultra-high-net-worth individuals — individuals with a net worth greater than $50 million — exhibits a similar pecking order. The US is by far the most dominant.

Of course, dollar millionaires represent a small percentage of the world’s total population. Credit Suisse estimates that there are about 5.1 billion adults in the world. About 56.6% have a net worth under $10,000 and about 0.9% (okay, 1%) are millionaires. This 1% controls/owns about 44% of global wealth. Thinking back to figure 7 (above), consider this math: 50% of the world’s millionaires are now in the US and China.

Fluctuations do happen, however. Australia lost some 124,000 millionaires last year largely because of a (-6%) drop in home prices, which tends to correlate pretty closely to the real asset part of household balance sheets. Australia shed about $443 billion in household wealth since 2018, making it the biggest loser in Credit Suisse’s report.

The other thing that you may find interesting from this report is the wealth/GDP ratio that they use. Household wealth and GDP tend to correlate. But the ratio of wealth to GDP also has a tendency to increase as a country develops. This makes sense because things like the rule of law and access to capital tend to increase people’s willingness to invest/borrow. But in developed countries, it could also be a signal for asset inflation.

The Canadian Real Estate Association (CREA) has updated its forecast for home sales activity this year and for 2020 via the Multiple Listing Service (MLS) Systems of Canadian real estate boards and associations.

Evidence suggests housing activity will continue to improve into 2020, with prices either continuing to rise or accelerating in many parts of Canada. Additionally, the Bank of Canada is widely expected to not raise interest rates in 2020.

Mortgage interest rates have declined, including the Bank of Canada’s benchmark five-year rate used by Canada’s largest banks to qualify applicants under the B-20 mortgage stress-test.

Under the $1.25 billion First-Time Home Buyer Incentive, the federal government contributes a portion of the home purchase price in exchange for an equity share of the home’s value.

Recent national sales trends have improved by more than expected over the second half of 2019 while new listings have fallen. These trends have caused many housing markets to tighten, which has sharply lowered the national number of months of inventory. In November 2019, this measure of the balance between supply and demand hit its lowest level since mid-2007.

Excluding the Prairies together with Newfoundland and Labrador, the combined number of months of inventory for the rest of Canada is at a 15-year low – just 0.1 months above the lowest level on record – and continues to fall.

The number of homes available for sale in these provinces, which represent over 80 per cent of national activity, is at a 15-year low. This is anticipated to support solid home price growth in 2020.

National home sales are projected to recover to 486,800 units in 2019, representing a 6.2 per cent increase from the five-year low recorded in 2018.

The small upward revision compared to CREA’s previous forecast reflects a stronger than anticipated uptick in activity in recent months in B.C., Ontario, Québec and Nova Scotia.

This represents the return of activity to around its 10-year annual average. On a per capita basis, the forecast for national sales this year is tied with 2008 and 2013 for the lowest since 2001.

British Columbia was the only province to weigh on the national sales figure in 2019, with sales for the province this year finishing 2.3 per cent below where they stood in 2018. Ontario and Québec provided most of the improvement in sales this year, with activity expected to be up 9 per cent and 11 per cent respectively.

The national average price this year is on track to rise by 2.3 per cent on an annual basis to just over $500,000.

In line with the balance between supply and demand across the country and trends earlier in the year, average prices in 2019 are expected to be down in the three westernmost provinces together with Newfoundland and Labrador, with robust gains in Ontario, Québec and the Maritimes.

National home sales are forecast to rise by 8.9 per cent to around 530,000 units next year. While sales are expected to trend higher, most of this annual increase in 2020 reflects a weak start to 2019 rather than a significant change in sales trends over the forecast horizon.

Of the forecast 40,000+ sales increase for 2020, British Columbia and Ontario are expected to contribute close to an additional 15,000 transactions each, while Québec and Alberta are anticipated to contribute 8,000 and 2,000 additional transactions respectively.

The national average price is forecast to rise by 6.2 per cent in 2020 to $531,000. Average price trends across Canada in 2020 are generally expected to resemble those in 2019, with small declines in Alberta, Saskatchewan and Newfoundland and Labrador, and solid gains in Ontario, Québec and the Maritimes.

In British Columbia, the average home price is expected to rebound next year following this year’s decline. In regions with supply shortages, price gains may exceed forecast levels should shortages become more acute than anticipated.


Thankfully, success in real estate doesn’t require an ability to predict the future. But having an idea where the market is heading is critical to making the right decisions.

PropertyGuys.com recently released a list of six trends that the company feels will have a lasting, potentially transformative effect on Canada’s real estate market in the coming years. Based on consultations with PropertyGuys’ network of agents, developers and customers in both Canada and the US, the trends presented paint a picture of a rapidly changing real estate environment where fulfilling tenant desires will require more of investors than simply adhering to the status quo.

PropertyGuys co-founder and lead analyst, Walter Melanson, says the trends identified suggest fundamental changes in the real estate market “that have us believing that this is more of what the future has to hold.”

Co-living

Before its catastrophic public flameout, We Work changed how the owners of commercial properties could exploit the sharing economy to drive rents for properties that were otherwise either vacant or failing to achieve the rent appreciation they needed to remain profitable.

Melanson says residential landlords are now considering using rental properties in the same way.

Most young city dwellers expect to have roommates anyway. By providing this new generation of renters what they’re looking for – furnished apartments, bigger shared spaces, free cleaning and wifi, and the company of likeminded people – landlords can charge premium per room rents. It’s like running a student rental, minus the holes kicked in the wall.

“The whole idea is that it builds community, it gives landlords a boost on rents that were going the wrong way for them, and it gives the people who rent the upside of having a way better place than they could ever afford on their own,” says Melanson.

Climate change impacting sales of new builds

As changing environmental standards force developers to alter how they build their properties, the cost of doing so will only increase over the short-term.

“We see this as one of the things that puts a lot of pressure on new development and new construction,” Melanson says. “The world’s becoming way more complex as it relates to building – getting permits, getting through the red tape. It changes so quickly, and it just gets harder and more expensive.”

Higher prices for new product could put a damper on sales of pre-construction properties, but the built-in appreciation associated with such assets should ensure that, by delivery date, an investor will have paid far less than the going rate.

New builds are old news

The increasing cost of new product and the built-out status of many urban communities has forced developers to move further and further away from city centres. Buyers still want new product, but the distances being placed between where they work and where they can afford to buy are becoming untenable. Melanson’s prediction is that buyers will see less value in new builds if it means being locked into an exurb lifestyle hours from where they actually want to live.

“What we’re seeing is people’s flight for affordability is pushing them as far as humanly possible from the city because there’s nowhere else to build,” he says.

That may be, but in Ontario and British Columbia, two provinces with surging populations, it’s safe to assume that there will always be someone willing to drive two hours to work if it means they can get a foot on the property ladder. And there is still plenty of room to build within minutes of most cities in Atlantic Canada.

Condos for families

Investors commonly think that the smallest property a family will be interested in renting is a townhouse. Melanson says that is no longer the case, and that new arrivals from overseas are frequently choosing condos as an affordable, convenient alternative to single-family properties.

“Newcomers don’t all have the same view as you and I on what a home’s supposed to be,” he explains. “We want all this space, and it doesn’t make sense for a lot of people moving from other parts of the world where they never had this space.”

Investors basing their choice between one- and two-bedroom units based on demand, take note.

Prices on the rise

Bad news for anyone hoping for a slowdown in the price increases affecting major markets like Montreal, Toronto, Vancouver and Victoria: increased demand will keep pushing home prices higher. The flatness in prices witnessed in Vancouver and Toronto over the first half of 2019 was a blip, a mirage. Investors looking for value will have to set their sights on less densely populated cities.

“Everyone in the world wants to live in Toronto, it would seem,” says Melanson. “And there’s nothing you or I could ever do to stop them. I don’t see anything in the foreseeable future that could change that fact.”

PropertyGuys also predicts noticeable price increases in Edmonton and Calgary. Based on recent government cuts and the headwinds that are still battering the province’s oil sector, CREW respectfully disagrees.

The move away from real estate agents

“Real estate is a hundred-year old business,” Melanson says. “The big brands trade the same way today they did almost a hundred years ago. The dynamics of their business being so agent-centric worked when the agent had the goods. They had the listing, they had the smarts, they had the data, and they had the secret data.”

Those days are over. With buyers growing more confident in the data they have access to, paying a realtor to provide similar, if not in identical, information will no longer be an automatic choice – particularly for new investors who may have never dealt with an agent before.

“You can learn more, do more, understand more and play the market a lot different than you would have 10 or 20 years ago when your reliance on a real estate agent was at its highest,” says Melanson.

CREW sees a day when buyers and sellers choose to market and list their own properties through an app rather than having to sit through a realtor’s sales pitch. But in our opinion, investors hoping to build a rock-solid, diversified portfolio are better off paying commissions to an investor-focused realtor than paying the higher long-term costs associated with choosing the wrong property.

Toronto’s low income renters should soon learn how they can access a portable rental housing benefit following the announcement of what amounts to a $1.4 billion deal co-funded and agreed on by the province and the federal government.

“Today’s announcement is another great example of how governments are working together to help our residents,” said Mayor John Tory, in a statement released prior to a Thursday morning press conference. “Making sure people have access to affordable housing is a top priority for me as Mayor and that requires the cooperation and support of other levels of government.”

Ontario’s program is expected to help at least 300,000 low-income renters, a federal target outlined in a bi-lateral agreement agreed on under the previous provincial government, dated April 2018, and was considered a significant victory for advocates who fought to have a benefit as part of the overall National Housing Strategy.

Priority will be given to households eligible or on a “social housing waiting list and households in financial need living in community housing. This includes survivors of domestic violence and human trafficking, persons experiencing or at risk of homelessness, Indigenous persons, seniors and people with disabilities,” a government release states. It did not contain specifics on when people could apply and exactly how the program would unroll.

Thursday’s announcement was made in front of a Toronto Community Housing building at 150 River Street, near Dundas Street East, and part of the newly revitalized sections of the Regent Park neighbourhood. That building contains 125 rent-geared to income units and 33 units of what is defined as affordable housing and whose residents were chosen through something of a lottery, said TCH spokesperson Bruce Malloch.

People who wanted to live in those affordable units, two and three bedroom apartments costing $1,194 and $1,331 respectively, submitted their names into a random draw and if selected their applications were considered.

The maximum household income for the two-bedroom units was $57,312 and the $63,888 for three-bedroom units.

Malloch said more than 1,800 applications were made for the two-bedroom units and more than 1,600 applications for the three-bedroom apartments and residents are starting to move in this week.

What constitutes affordable housing is typically based around numbers reported out by the Canada Mortgage and Housing Corporation, which tracks what people are paying for occupied purpose built rental units. Condominiums are considered a separate category and are not included.

Housing is considered affordable if it matches or is lesser than the average of those occupied purpose built rentals, which are subject to rent control. In Toronto landlords can charge whatever they want for emptied out units and any units occupied after mid-November 2018 have no rent controls at all.

Across Old Toronto, the average cost for a two-bedroom apartment in 2018 was $1,829 and a three bedroom was $2,473, according to the most recent CMCH rental market housing report for the Greater Toronto Area.

Research firm Urbanation reported that average rents for newly leased or available purpose built rental units was at about $2,515 per month, in an October news release. The release did not include unit size.

Using data from Turner & Townsend, Curbed recently reported that the most expensive city in the world in which to build is now San Francisco. On average, it costs USD 417 per square foot. San Francisco is followed by New York ($368 psf), London, Zurich, and Hong Kong. New York took the top spot last year, but San Francisco shot up this year because of, you know, tech.

This number was calculated using a blend of six different types of construction, everything from apartment high-rise and prestige office to general hospital and warehouse distribution centers.

Now, I’m not exactly sure what this number includes. But I’m assuming it is only direct construction costs and doesn’t include (contractor) general conditions, land, or any soft costs, which are all significant. Once you add in these other cost inputs, I am sure that you can start to see how things — including the cost of new housing — can quickly escalate.

If you’re struggling to find a place to rent in Mississauga, you should prepare for a challenging market marked by even higher prices in 2020.

In fact, the recently-released Rentals.ca December 2019 Rent Report, produced by Rentals.ca and Bullpen Research & Consulting, suggests that rents could climb 8 per cent in Mississauga next year.

When it comes to significant increases, Mississauga leads the pack. Other cities where rental rates are expected to increase include Toronto (7 per cent), Montreal (5 per cent), Ottawa (4 per cent) and Vancouver (3 per cent).

Rents in Calgary and Edmonton could drop 1 per cent, according to the report.

The report predicts that average monthly rents for Canada overall will increase by 3 per cent in 2020.

As for where rates stand right now, the average rent for Canadian properties in November 2019 was $1,918 per month, an increase of 9.4 per cent annually.

In November of 2018, the average rental rate was $2,232 for all property types listed on Rentals.ca in Mississauga. According to the report, that rate increased to $2,405 for November 2019, an increase of 10.2 per cent annually.

Overall in 2019, the average rent was $2,504 per month.

Mississauga finished sixth of 34 cities listed for average monthly rent in November for one-bedroom units at $1,934 and fifth for a two-bedroom at $2,416.

Toronto remains the priciest city for renters looking for a one-bedroom home, with the average monthly rent sitting at $2,314. Vancouver has the most expensive average monthly rents for a two-bedroom, topping the $3,000 mark at $3,058.

What prices can Mississauga tenants expect in 2020?

The report says the linear forecast calls for the average rent in 2020 to surpass $2,600, but Rentals.ca and Bullpen forecast that December 2020 rent will be $2,585 per month on average, an 8 per cent annual increase.

The report says this forecast is a slight moderation from the correct 10 per cent annual growth forecasted from December 2018.

“Mississauga will continue to move parallel to the former City of Toronto with prospective renters fleeing Toronto for less expensive units or larger properties,” the report reads.

The good news is that the price increases could, in time, be modified by an influx in new rental inventory.

The report says the impact of the mortgage stress test has started to fade and developers and investors are looking to increase rental supply to offset the increase in rental demand. At a time when fewer people can afford to purchase homes (and when more and more people are moving into the GTA), developers are working on developing more purpose-built rental housing—and that’s good news for tenants.

At the end of the third quarter, the Canada Mortgage & Housing Corporation reported that almost 72,000 rental units were under construction in Canada, the highest rate in over 30 years.

The majority of listings on Rentals.ca are rental and condominium apartments and the chart below looks at the average rent and the annual change in average rent for a select number of Canadian municipalities (and former municipalities prior to amalgamation) in November 2019.

Average monthly rent for Mississauga rental and condominium apartments only increased 7 per cent year over year.

According to the report, Hamilton and Scarborough led the pack with year-over-year rent growth of 25 per cent and 23 per cent, respectively for apartments with rental or condo tenure.

On a provincial level, Ontario had the highest rental rates in November, with landlords seeking $2,339 per month on average (all property types), up from $2,334 in October, and 9.1 per cent annually from $2,144 in November of 2018.

The report says the annual increase in rents is supported by some of the smaller municipalities such as London, Hamilton, Kanata, Burlington, and Kitchener, which are all experiencing double-digit rent growth when considering all property types.

The report also notes that developers are looking to cater to more affluent renters, including those shut out of the ownership market by increasing prices, younger renters choosing to be tenants for lifestyle reasons, and boomers and empty-nesters trading down from a larger dwelling.

“After years of focusing on the ownership housing market,” said Ben Myers, president of Bullpen Research & Consulting, “The media has focused more attention on the rental market as the mortgage stress test, expanded rent control, changing Airbnb legislation, rapid population growth, and record rental housing construction continues to disrupt the balance between supply and demand nationally. We expect the market to continue to be undersupplied overall in Canada in 2020.”

Some moderation is expected in 2020.

“After two years of unprecedented rent growth, we expect some moderation in 2020,” said Matt Danison, CEO of Rentals.ca. “There should be some supply relief in the Greater Toronto Area in 2020, but Rentals.ca and Bullpen expected average rental rates for all property types in Toronto and Mississauga to increases by 7 per cent to 8 per cent next year.”

The National Rent Report charts and analyzes monthly, quarterly and annual rates and trends in the rental market on a national, provincial, and municipal level across all listings on Rentals.ca for Canada.

The use of technology to review contracts is already rising fast in the legal services industry but a Vancouver firm hopes to find traction in the real estate industry.

Eli Technologies has claimed a world first with its artificial intelligence (AI) powered condo and strata document review platform which helps real estate professionals to review and uncover potential issues.

Using machine learning, the Eli Report platform can review years of documents and data within minutes.

“We recognize that buying a condo is one of the largest and most important purchases an individual can make, especially first-time home buyers,” says Jamie Hankinson, CEO of Eli Technologies. “A proper review of the strata documents can be very time consuming and complex, but is an essential part of the condo purchase process. We are excited to launch Eli Report in B.C. so real estate professionals can use the platform as a second set of eyes to identify potential concerns, allowing them to elevate their level of service, and better inform their clients.”

The platform has been in beta testing since last year but now has over 500 realtors across 75+ brokerages in Metro Vancouver and Victoria registered and is now available to all realtors, mortgage brokers and property managers throughout British Columbia.

Probably more often than not in today’s new home builds – but understanding your rights as a purchaser and the responsibilities of your developer are key to determining whether you should apply for compensation from your builder.


Our team is well versed in occupancy legislation and will help you receive the money you are entitled to in the case of Occupancy Delays.

“Many of our clients come to us not knowing if they qualify, but they are frustrated with the delays they have experienced with their builder. Condominium developers are notorious for pushing the envelope when it comes to meeting occupancy dates. Purchasers have rights and the more you know, the more power you have and it might just mean up to $7,500 back in your pocket. That’s something worth investigating.” – Mark Purdy


They Delay. They Should Pay.

Your Rights

You have the right to occupancy of your new home based on the dates confirmed by your builder, either in the Purchase Agreement, or within the letter(s) provided, within an accepted period of time prior to occupancy. If that occupancy is delayed and sufficient notice is not provided, the purchaser may qualify for compensation up to $7,500.

  • Occupancy is made available after the Firm Occupancy Date.
  • The builder failed to provide sufficient notice when changing the Tentative Occupancy Dates or notify you of unavoidable delays.
  • The builder missed the Outside Occupancy Date.
  • You exercised your right to terminate the purchase agreement due to delay.

You must file for occupancy compensation within 1 year of occupancy, or you lose the right to claim.


Builder’s Responsibility

  • Your builder is responsible for providing you, the purchaser, with written notice of any delay in occupancy with a minimum of 90 days written notice. Provided they meet this minimum of 90 days’ notice they can change the tentative occupancy date as often as they like, provided they don’t go beyond the Outside Occupancy Date.
  • Once a Firm Occupancy Date is set the builder must meet this date unless an unavoidable delay occurs.
  • The delay in case of an Unavoidable Delay may not be longer in duration than the actual length of the delay. For example, if they are delayed by 10 business days due to a worker’s strike, your builder may not delay by more than 10


Understanding Your Purchase Agreement

Don’t get caught in a war of words. Understanding your PURCHASE AGREEMENT is key to ensuring you know your rights and the responsibilities of your builder. Let’s look at the most common terms you might see:

PURCHASE AGREEMENTS

A written document in which the purchaser agrees to buy certain real estate and the seller agrees to sell under stated terms and conditions. This is the offer-to-purchase document that makes up the core of a real estate transaction.

STATEMENT OF CRITICAL DATES
This is an agreement of all key dates for occupancy and purchaser termination. This is in place to protect your rights as a purchaser.

FIRM OCCUPANCY DATE
The completion and move-in date that you and your builder agreed upon. If this date is not met, your builder must set a Delayed Occupancy Date and you are entitled to delayed occupancy compensation.

DELAYED OCCUPANCY DATE
A new date, which has been provided by the builder. If a delayed occupancy date is set, you are eligible for occupancy compensation.

FIRST TENTATIVE OCCUPANCY DATE
The builder’s best guess as to the estimated time of occupancy. This date will either by confirmed or extended as building progresses

OUTSIDE OCCUPANCY DATE
This is the latest date that your builder agreed to provide you with occupancy of your condominium unit or home. This is decided upon signing of the purchase agreement as is included in the Statement of Critical Dates.

UNAVOIDABLE DELAY
Builders are protected against delays that are considered unavoidable., such as natural disasters, workers’ strike, fire, etc… If there are unavoidable circumstances, there is a provision that allows the builder to negotiate an extended occupancy date by mutual consent.

TERMINATION PERIOD
If your home is not complete and move-in ready by the Outside Occupancy Date, you, as a purchaser, have a 30-day period in which to terminate the agreement. You are still eligible for occupancy compensation even if you terminate the deal.


HAVE QUESTIONS? GIVE US A CALL!
416-599-9599

The Bank of Canada (BoC) announced today that it would keep the overnight rate at 1.75%.

The Bank Rate is correspondingly 2% and the deposit rate is 1.5%. The BoC has maintained the current overnight rate since last October, when it was raised from 1.5%.

No one really expected the central bank to raise rates, but there was speculation that the rate would drop back to 1.5%, even though a recent survey indicated a “near certainty” of a rate hold, This lack of movement makes Canada somewhat of a holdout among other central banks around the world that are dropping rates to help their local economies in an uncertain global economic climate.

“There is nascent evidence that the global economy is stabilizing, with growth still expected to edge higher over the next couple of years. Financial markets have been supported by central bank actions and waning recession concerns, while being buffeted by news on the trade front. Indeed, ongoing trade conflicts and related uncertainty are still weighing on global economic activity, and remain the biggest source of risk to the outlook,” the central bank wrote.

Growth in Canada slowed as expected in the third quarter of 2019 to 1.3 percent, and stronger wage growth led consumer spending to a moderate expansion. Housing investment was also a source of strength, supported by population growth and low mortgage rates. Consumer spending and housing activity are important sources of resilience in the Canadian economy, and the BoC indicated that it would continue to be on alert for any financial vulnerabilities that may affect the household sector.

“Future interest rate decisions will be guided by the Bank’s continuing assessment of the adverse impact of trade conflicts against the sources of resilience in the Canadian economy – notably consumer spending and housing activity. Fiscal policy developments will also figure into the Bank’s updated outlook in January,” the BoC wrote.

The overnight rate is the interest rate at which major financial institutions borrow and lend one-day (or “overnight”) funds among themselves; the Bank sets a target level for that rate. This target for the overnight rate is often referred to as the Bank’s policy interest rate.

Changes in the target for the overnight rate influence other interest rates, such as those for consumer loans and mortgages. They can also affect the exchange rate of the Canadian dollar.

The next interest rate announcement is January 22nd.

The City of Toronto has released a comprehensive housing blueprint to assist more than 341,000 households over the next decade.

The HousingTO 2020-2030 Action Plan provides 13 strategic actions that looks to address the “full continuum” of housing – including homelessness, social housing, rental housing, long-term care, and home ownership. Some of the highlights include a revised housing charter and the creation of a multi-sector land bank to support the approval of 40,000 new rental and supportive homes.

Implementation of the full plan over 10 years is estimated to cost governments $23.4 billion, with the city’s commitment through current and future investments being $8.5 billion.

Mayor John Torry said that he “will be working hard with the other orders of government to ensure the entire HousingTO Action Plan is fully funded”

“This has to be a priority — we have to come together to support households who are struggling to pay the rent and keep, or put a roof over their heads,” said Torry. “Ensuring that residents in our city have access to housing will benefit our entire city. It gives people the opportunity to meet their full potential and to participate in our city’s success. Together we can make a difference and make Toronto a place that anyone who wants to, can call home.”

Ben Myers of Bullpen Research & Consulting was recently interviewed by Newinhomes.com about the state of Toronto’s new housing market. Ben is always interesting. And these are the sorts of things that I read in my spare time. So here’s an excerpt:

The average price of popular new condo floor plans in the City of Toronto in October 2019 was approximately $1,275 per-square-foot (psf) and with growth of 3% a year, prices would hit $1,475 psf in 2024. I wouldn’t be surprised to see annual average growth of 4%, which would get you to $1,625 psf in five years in Toronto.

This data was taken from BuzzBuzzHome and — by “popular new condo floor plans” — I believe he means that these are the floor plans that buyers tend to click on and review when they visit the site. So it’s a good indication of buyer demand.

Here’s another quote that stuck out:

Part of the reason that price growth has spiked is a rise in construction costs, development charges, and land prices – this cost-push inflation is passed on to consumers.

That sounds right. And I have been writing about this phenomenon all year. Most of us can probably remember when $1,000+ psf was a high water mark for new construction condos. Now it’s pretty much a floor.

Ontario Economic Overview

With 2019 approaching its end, Ontario’s economic growth for 2019, at just over 1%, is forecasted
to underperform the national average of 1.4%, with 2020 only expected to see about 0.75% growth
compared to Canada’s 1.1%. The Greater Toronto Area (GTA) and Ottawa-Gatineau regions are
expected to see stronger growth than the province as a whole, at 1.2% and 1.0%, respectively in
2020. To encourage growth across the nation the BoC is expected to cut the benchmark interest rate
before the end of 2019, followed by a another potential rate cut in early 2020 to provide the necessary
economic stimulus to overcome a slowing global economy. However, headwinds are building, with
slower U.S. expansion and elevated trade policy uncertainty likely to weigh on growth in 2020. The
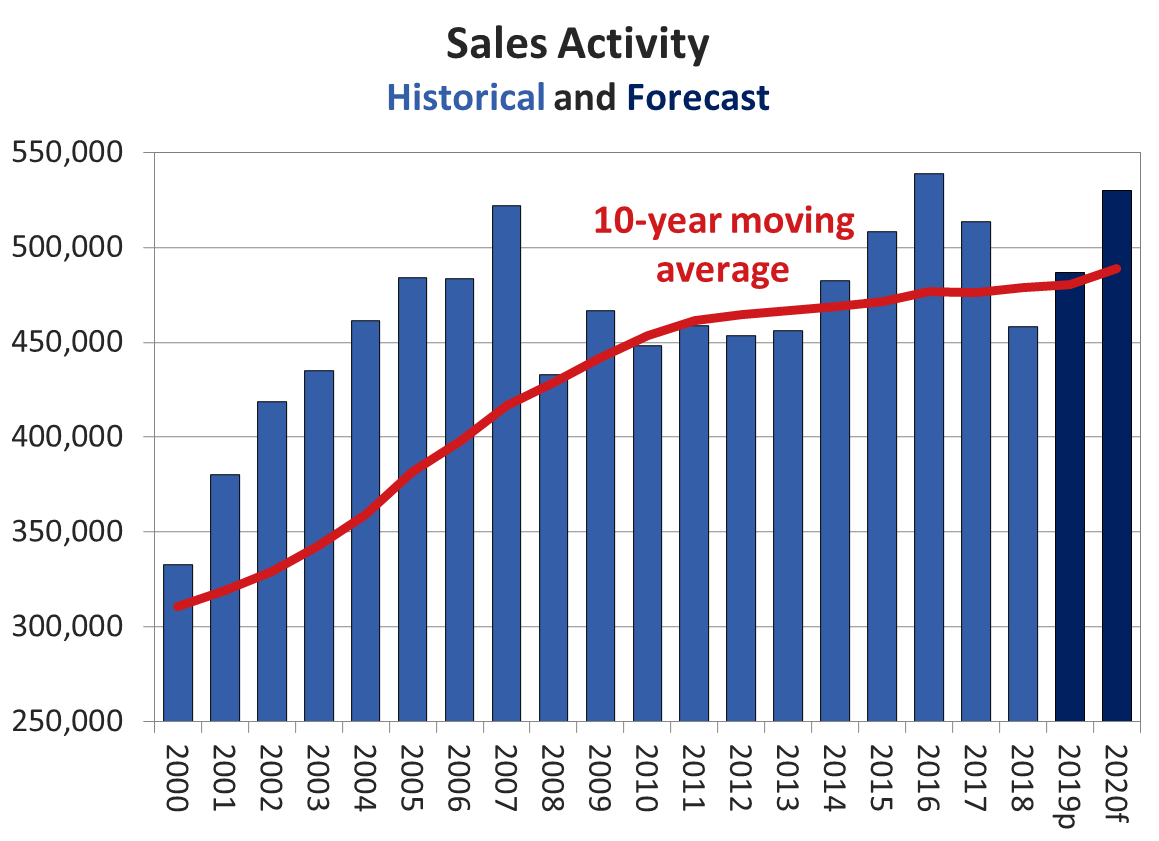
housing market in Ontario is the silver lining, as this sector weighed on economic growth in 2018
and early 2019, specifically in the GTA, however, it sprung to life in the spring and continues to show
increased in both sales activity and pricing.

Ontario’s labour market remains strong as a healthy influx of immigrants continues to help
companies secure workers amid tight labour market conditions. With the unemployment rate at 5.8%
at the beginning of 2019, employment growth in the province ramped up and by the end of October,
the unemployment rate had decreased to 5.1%. Along with a thriving tech sector in the GTA, Ottawa
and the Kitchener-Waterloo regions, much of the employment growth has occurred in the FIRE
sector, which is once again benefiting from the recovery of the residential real estate market. On the
industrial space-using side, the Transportation and Logistics sector continues to experience steady
growth with the rise of e-commerce services like fulfillment centres and distribution facilities. Ontario
is expected to see employment grow by 2.7% in 2019 and 1.0% in 2020. However, there is a disconnect
between strong job markets and consumer spending. With inflation in Ontario for 2019 expected
to come in at 1.9%, highly indebted households are keeping a tighter grip on their wallets with very
little savings to fall back on. Furthermore, business activity indicators are showing some cracks with
an abatement of U.S. and U.K.-bound exports. The downgraded profile for U.S. GDP and weakness
in the U.K., the two largest Canadian export markets along with elevated political uncertainty could
continue to hamper business investment in Canada and Ontario.
As the Liberals begin their second term on Parliament Hill, the public administration sector is
expected to slow as a result of Federal government spending plans, which will impact Ottawa
specifically, however, the high-tech sector is expected to continue growing, driving demand for space.
Expect much of the federal government’s attention to be on the West coast of Canada, specifically
Alberta, as the Liberals attempt to quell the Wexit movement and appease the Conservatives, while
also attempting to create alliances with the NDP and Bloc.
The continued concerns about high consumer debt and newer concerns about inflationary pressures
being brought on by trade wars could weigh down the performance of commercial real estate.
However, with heavy investment in infrastructure, continued growth in both residential and nonresidential construction and growing labour markets, Ontario is poised for a steady conclusion to 2019
with strong fundamentals throughout 2020.
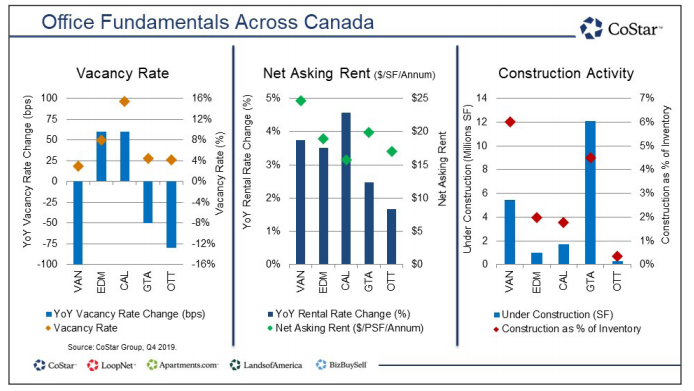
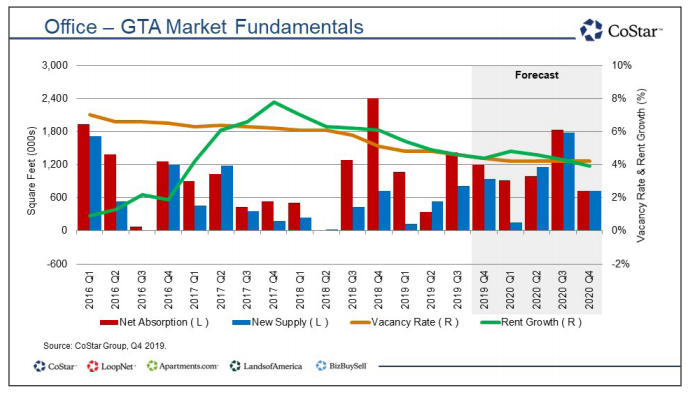
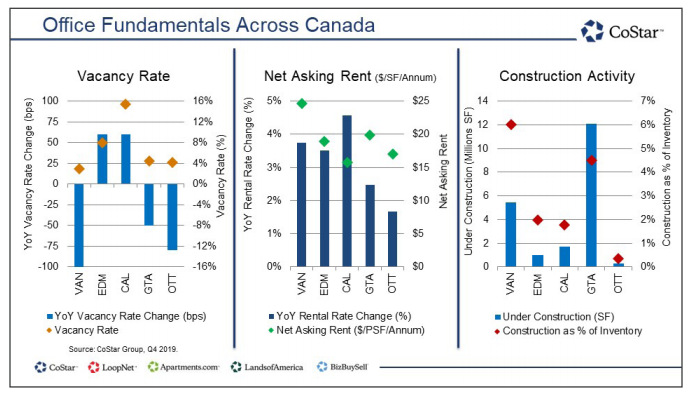
GTA Office Overview

The GTA’s office market had a record year in 2019, while being recognized as one of the strongest
office markets in North America. Deeply entrenched in landlord control, the market saw its overall
market vacancy rate drop 50 bps year-over-year to end 2019 at 4.5%, with the average net asking
rental rate up 2.5% year-over-year to $19.85/SF per annum.
The good news on the supply front is that construction activity continues to increase, with 12.1 million
SF now under construction, representing 4.5% of existing inventory. This includes CIBC Square at
just under 1.6 million SF with CIBC as the lead tenant; the 1.2 million SF office project at 160 Front St.
W., by Cadillac Fairview with the Ontario Teachers’ Pension Plan as the lead tenant; as well as the
879,000 SF project at 16 York St. also developed by Cadillac Fairview with HSBC slated to be the lead
tenant. Furthermore, Oxford Properties continues to market their proposed 1.4 million SF (60-storey)
office tower, The HUB, at 30 Bay St. Along with these projects, Cadillac Fairview’s mixed-use East
Harbour development is planned to be Toronto East’s flagship destination with exceptional transit
connectivity.

With strong demand from finance and technology companies continuing to drive vacancy down,
rental rates are expected to continue increasing, and this new supply will not help alleviate the
tightening market conditions until they start being delivered between 2020 and 2022. As a result,
there are only three blocks of contiguous space 30,000 SF or larger in tech dominated submarkets
such as Downtown West and Liberty Village, and currently only 12 existing properties in the entire GTA
that can accommodate a tenant looking for 100,000 SF or more of contiguous space.
Downtown vacancy remains exceptionally tight as overall vacancy decreased to 2.1%, the lowest
downtown vacancy rate in North America. Landlords are keenly observant of this fact and are
increasingly selective in the types of tenants they are choosing for their space. In light of the strong
fundamentals supporting the Downtown market, landlords are looking for tenants with time-tested

sustainable operations and strong covenants before committing to a lease. While downtown vacancy
is moving down, suburban vacancy also experienced a drop of 190 bps year-over-year and the delta
between downtown and suburban vacancy rates has shrunken to 290 bps from a whopping 470 bps
at this time last year. As a result of the tight downtown market with limited options, tenants will likely
need to pay more attention to the suburban markets if they need a large amount of space in 2020.
The delta between downtown and suburban net asking rental rates is equally impressive. Downtown
rents ended 2019 at $31.71/SF, whereas suburban rents are around $16.31/SF, representing a difference
of $15.40/SF per annum. This is not indicative of the suburbs being in peril, as there remains strong
demand for space in the more urbanized suburban locations, such as Mississauga City Centre,
Vaughan Metropolitan Centre and Downtown Markham. With demand remaining strong, and new
supply limited in the short term, expect rental rates to continue edging up across the city.

The wild card for the GTA office market outlook will be the progression of Google’s Sidewalk Labs
project. The proposed ‘smart city’ development slated for the Port Lands on Toronto’s eastern
waterfront is generating controversy in terms of privacy of personal data, methodology behind
information gathering and how the development will be financed and managed. With 3.3 million SF
of office and retail space, the smart city is the largest attempt to integrate technology with urban
planning in North America. If the project were to get underway to the scope initially unveiled by

Sidewalk Labs, it would immediately impact the office, housing and employment markets. The GTA
receives approximately 100,000 new immigrants (international and domestic) to the area each year,
and the GTA economy is more than capable of providing the skilled talent at the quantity needed for
this project, as well as providing housing for them to live, without the increased demand upending
either the labour or housing markets.

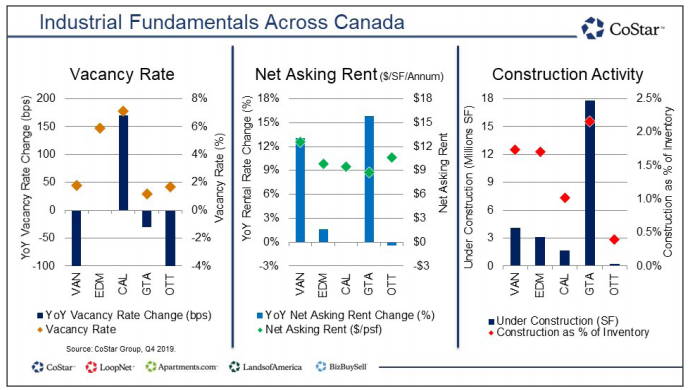
GTA Industrial Overview
Despite the strong rhetoric regarding trade wars and weak retail sales, the GTA industrial market
has experienced continued strong demand. Industrial is the new retail, and much of the industrial
demand in the GTA is primarily driven by transportation, warehousing and logistics tenants, whereas
manufacturing did see a decline in the past year. The high cost of energy is one of the reasons
being cited for the pullback in manufacturing. The PC party pledged to reduce energy costs in their
provincial election campaign last year, however the benefits from lower energy costs will likely not
result in a wholesale return to manufacturing the GTA.

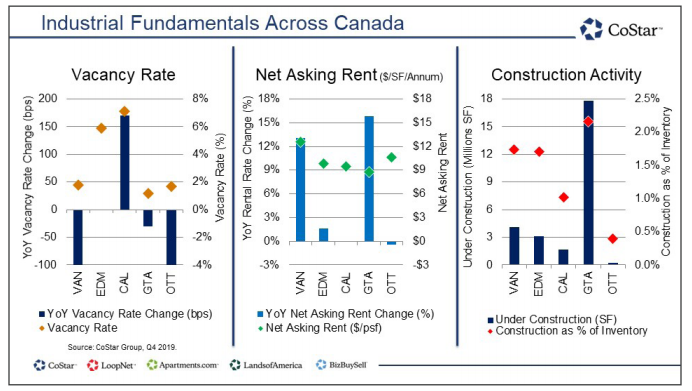
Along with the insatiable demand and limited supply, the GTA is now facing land shortages, which will
impact the velocity and costs of future construction activity. Projections show that the GTA industrial
vacancy rate will continue edging down below 1.0% in 2020, before starting to climb slightly back
above the 1.5% range by 2021. Such incredibly tight conditions will continue to exert upward pressure
on the overall average asking net rental rates, with expectations for rents to reach approximately
$9.45/SF in 2020 and eclipsing $10.00/SF in 2021.
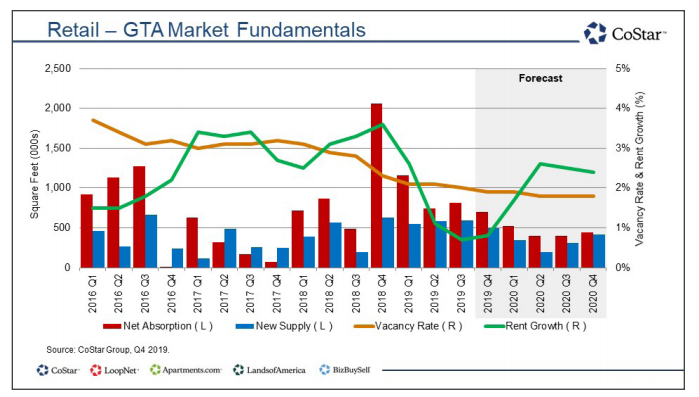
GTA Retail Overview
The GTA retail market continues to receive new international retailers who are either looking to enter the
GTA market, or are using the GTA as a launching pad to the rest of Canada. The newly opened Eataly,
which opened its doors in November at the Manulife Centre in Toronto, is a perfect example of this. The
retail markets vacancy rate edged down 40 bps year-over-year to end 2019 at an impressive 1.8%, with
the average net asking rent up 7.5% over the same period to $26.97/SF per annum. However, market
rent growth has been slightly weaker, reflecting concerns about the retail market in relation to weak
retail sales and retailer performance.

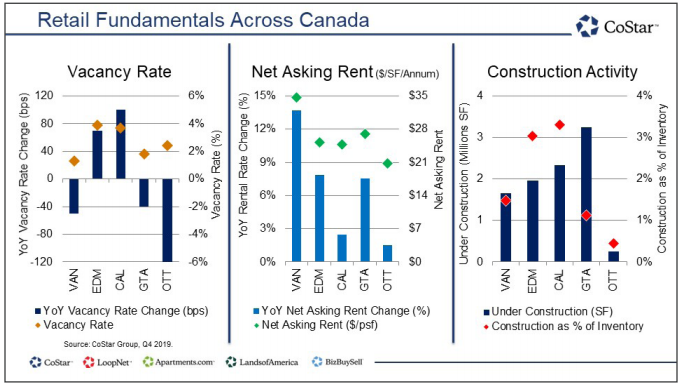
Construction activity has been relatively slow, with only 2.2 million SF of new supply delivered since
Q3 2017, and construction activity has moved down from 3.7 million SF last year to 3.2 million SF at
year-end 2019, representing only 1.1% of existing inventory, with much of this construction activity
being part of mixed-use projects, or expansions to existing malls. Despite the new vacant space that
came to the market as a result of Sears Canada closing in Q1 2018, the limited amount of new supply
has not been enough to satisfy the demand from tenants who are struggling to find space amid low
vacancy and increasing rents. However, with recently announced store closures, and street front and
even mall vacancies creeping back onto the market, expect vacancy rates to rise over the coming
year to end 2020 at 2.4%.

Despite the impressive fundamentals, the economic forecast could prove detrimental to the
retail landscape. The latest national GDP data indicates that retail activity has come off the boil.
Furthermore, retail sales have been showing weakness for some time, with much of the total increase
in retail sales has been the result of inflation and population growth. Although retail sales growth
is expected to remain positive, high consumer debt is expected to hinder retail sales going forward,
despite any expectations for the BoC to cut interest rates. However, GTA retail sales are expected to
increase by over 2.0% each year out to at least 2025, but much of that growth will be captured by
e-commerce as opposed to brick and mortar retail.
In order to combat the effects of e-commerce on the retail market, landlords of premier quality
properties continue to work on improving their properties, making them experiential destinations.
The making of an experiential destination goes beyond just having more restaurants and services
in malls, and can include ventures such as Ivanhoe Cambridge and Cirque du Soleil teaming up to
offer family entertainment centres in shopping centres, which is due to launch early 2020. Landlords
are looking at ways to further differentiate themselves from the rest of the pack in order to attract
more shoppers as well as new and better retailers. Expect to see this, along with more intensification
of retail properties and repurposing of parking lots in suburban malls, as seen at properties such as
Yorkdale Mall, and Aoyuan’s redevelopment plans for Newtonbrook Plaza.

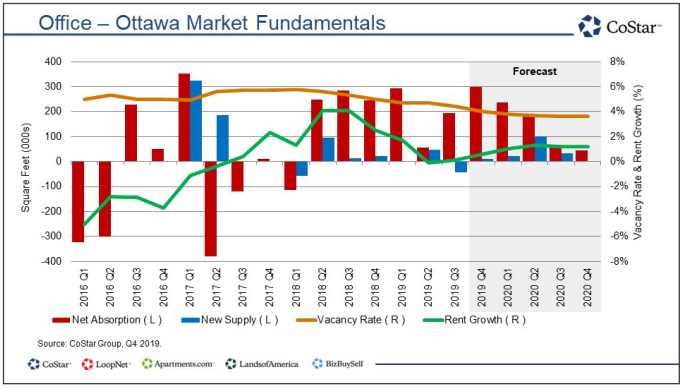
Ottawa Office Overview
Ottawa commercial real estate is experiencing a renaissance with renewed interest along the LRT
line and other well-located properties for the purpose of redevelopment or development. Occupancy
gains were attributed to leasing by technology and federal government tenants throughout 2019
with the now fully operational phase 1 of the LRT line acting as the biggest demand driver. The LRT
has made well-positioned buildings winners in the office market, particularly properties that have
stops integrated into their buildings. The LRT’s completion will secure higher rental rates in buildings in
close proximity and become a main feature in retaining old tenants and attracting new ones. Easier
accessibility outside of the Downtown Core could also continue lowering vacancy rates in both the
western and eastern submarkets. Furthermore, with federal spending likely to curb due to the election
outcome, government leasing is likely to slow down; however, this will allow private sector tenants to
either expand or move into the market with less competition.

Overall vacancy in Ottawa is down 80 bps year-over-year to end 2019 at 4.2%; however, net asking
rents were up only 1.7% over the same period, to $16.98/SF/annum. Construction activity has been
underwhelming over the past years but a handful of projects should begin to change the narrative
across the city. Of the projects that are under construction, most are larger mixed-use projects,
with only a portion slated to be office space. The largest example of this being the waterfront
development Zibi, expected to bring approximately 240,000 SF of office space to the market. Close
behind is 900 Albert St., a mixed-use and transit oriented development comprised of 200,000 SF of
office space. Like many of these projects, 900 Albert St. is located along the new LRT Line. However,
other projects, such as Taggart’s 153,000 SF design build in the Kanata West business Park for Kinaxis,
a supply chain planning software company, should kick off shortly.

Although high-tech companies and the Federal government have long been part of the office market
tenant mix in Ottawa, the Federal government is beginning to embrace the concept of flexible work
space and choosing to occupy more space in the suburban markets over the last few years, which
has resulted in higher vacancy downtown. This has created opportunities for high-tech tenants who
might be looking for more urban locations with access to public transit. Expect demand to outstrip
supply in 2020 and beyond, with vacancy continuing to edge down.

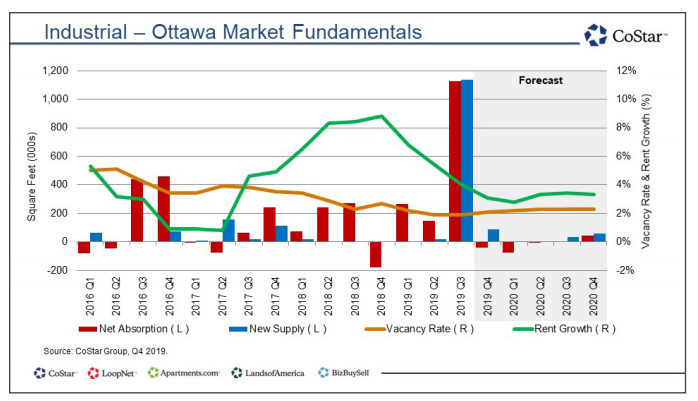
Ottawa Industrial Overview
The Ottawa industrial market has experienced relatively strong demand throughout 2019, with
vacancy down 100 bps to end 2019 at 1.7%. As a result of tightening market conditions market rents
continue to increase, despite asking net rental rates appearing flat year-over-year at $10.63/SF per
annum at the end of 2019. This continues to raise the question of whether tenants are willing to wait
for new space or pay record high rental rates for existing older stock.

Although the market experienced significant new supply in 2019, 1.0 million SF of the 1.2 million SF
delivered in 2019 was the result of the new Amazon fulfilment centre, resulting in no real alleviation to
continuously tightening conditions. Both the developer and the City of Ottawa hope that this project
will breathe new life to the city’s industrial development pipeline and kick off more new speculative
construction in the region.

Looking forward, there is currently only one major project to speak of that could satiate demand
from new or expanding tenants in the Ottawa market. Broccolini’s proposed 700,000 SF speculative
development is interesting not only because of its size, but also because they have applied to the
City to raise the height of the building from just under 50 feet to almost 100 ft. The question is, what
would you do with a 100-foot tall single storey industrial building? Despite this potential project,
the lack of new supply and availability of quality space, in particular large blocks, will contribute to
continued tight market conditions and higher asking rental rates.

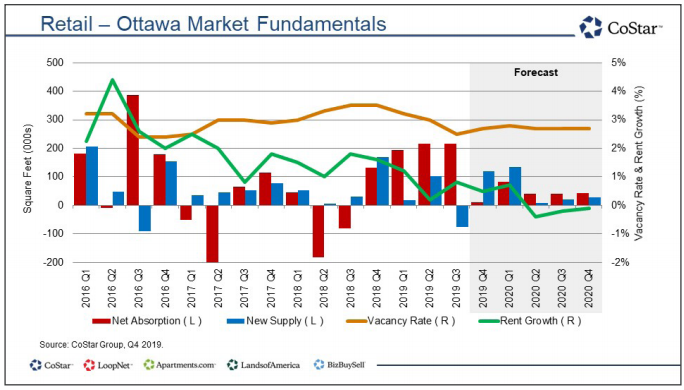
Ottawa Retail Overview
The Ottawa retail market has experienced a 120 bps year-over-year drop in vacancy to 2.7% at the
end of 2019. This drop is partially the result of retailers opening new locations at the Cadillac Fairview
Rideau Centre earlier this year and the slow rollout of legal cannabis brick-and-mortar stores. As a
result, average net asking rental rates have steadily increased, however, they are only up 1.5% yearover-year to end 2019 at $20.96/SF per annum.

Construction activity has been relatively slow as well with only 534,000 SF of new supply delivered
since Q2 2017 and only another 252,000 SF currently under construction, mainly as part of the
podiums of mixed-use residential projects along the new LRT lines. Given the forecast of demand for
space along the LRT lines, this construction activity will likely not meet demand over the coming years,
and redevelopment of the areas adjacent to the new transit line seems likely.
Ottawa’s retail sales growth is expected to remain strong in 2020, at 2.1% growth, however, as the
potential for pullbacks in the public administration sector weigh on the outlook, retail sales growth
is expected to fall below 2.0% for the foreseeable future thereafter. Furthermore, high debt service
costs and competition from the rise of e-commerce, especially now that Amazon is in town, will take
a bite out of retail sales activity. Developers will look to give buildings in close proximity to the LRT a
facelift while retailers in older buildings, in less than ideal locations, may have to close their doors due
to increased costs and lackluster sales growth. The upside of this shift would be new and fresh retail
space available upon completion, leading to continued interest from diversified international retailers.

Landlords continue to look for ways to differentiate their properties and make them more experiential
destinations in order to combat the effects of e-commerce on the retail market, and the Ottawa
market has not been immune to this. Expect to see more intensification of retail properties and
repurposing of parking lots, specifically along the LRT lines in the coming years.

Source: CoStar

Like all markets, the housing market in Ontario is driven by the laws of supply and demand. Strong demand for housing has created a persistent supply challenge that can only be solved, simply, by boosting the number of new homes being built.

This approach makes sense. It is supported by numerous economists and academics. This is why the Building Industry and Land Development Association is encouraged by the provincial government’s focus on boosting housing supply.

Every month, BILD releases the previous month’s new home sales data, gathered by Altus Group, tracking the relative health of the new housing market as reflected in sales, inventory, price per square foot and comparisons to historical trends. The data we released for September pointed to a modest recovery from the slump of the previous year, but, given that new home sales and inventory increased in tandem, the data underscored that the GTA continues to experience a significant housing-supply crunch.

In previous columns, I have highlighted that the GTA is one of the fastest growing metropolitan areas in North America, with an average of 115,000 net new residents per year. Our population is expected to reach 9.7 million by 2041. Given this robust growth in population, demand for housing of all types — to buy or rent — is strong and will remain so.

The challenge is that the supply side of the housing equation in Ontario is highly regulated and dependent on factors that can make it less responsive to demand signals. The first of these factors is the supply of land designated for residential construction and serviced with the appropriate infrastructure. Within the cities of the GTA, the amount of available lands for new residential construction has been steadily decreasing.

Another factor that restricts our housing supply relates to planning and approvals. New housing cannot simply be built any time, anywhere. All new housing projects go through a complex and lengthy approval process, subject to multiple pieces of provincial regulation, which is interpreted and administered by municipal governments. This slows the supply side from being able to meet demand signals. As a result, in the GTA it takes on average of 10 years to complete a typical highrise project and 11 years to complete a typical lowrise project.

Like a growing number of governments around the world, the Ontario provincial government has recognized that achieving balance in the housing market starts with increasing supply. The government recognizes that adding new homes helps moderate prices, creates trickle-down housing opportunities for those looking to enter the housing market and has a beneficial impact on the rental market.

French architect Jean Nouvel has designed a sprawling, stone-clad residential development for the outskirts of Quito that echoes its mountainous surroundings.

Ateliers Jean Nouvel has created Aquarela for Cumbayá, a rural area east of the Ecuadorian capital, in collaboration with local architectural developer Uribe & Schwarzkopf.

The 136,580-square-metre project will comprise nine residential blocks wrapped by curved balconies covered in stone. Greenery will be planted in rocky gardens inside these – and flow over the tops – to give each resident a connection to the outdoors.

Behind the rocky exterior, the walls of the homes will comprise large expanses of glass and tall slatted wooden shutters that will fold open to reveal the mountainous backdrop.

Each residential block will also have access to its own rooftop pool and a number of elevators so each resident only shares their lift access with one other tenant. Renderings of the scheme released by Uribe & Schwarzkopf show that greenery will continue inside, with plant-covered walls lining the lobby.

A typical two-bedroom apartment inside will have an open-plan living area with glazed doors that lead onto a private terrace surrounded by rockery. Each bedroom will also have an en-suite bathroom.

The first portion of Aquarela is already under construction, and slated for completion in 2020. This block will include the clubhouse with a range of amenities, such as a bowling lane, an ice rink, a yoga studio, music room, mini-golf and a cinema.

Other facilities include access to football, squash and tennis courts; areas designed for young children and teens; workspaces, a hairdressers, event spaces, a gym, spa and a swimming pool

French architect Nouvel recently completed the National Museum of Qatar in Doha and the Louvre Abu Dhabi in the United Arab Emirates capital. He hit the news last month when it was revealed he was counter-suing the Philharmonie de Paris over a “totally disproportionate” late-fee.

Nouvel, the 2008 laureate of the annual Pritzker Prize, joins a host of well-known international architects that Uribe & Schwarzkopf has enlisted for major projects in Quito.

Arquitectónica and YOO studios, which is run by Philippe Starck and John Hitchcox, worked together to complete YOO Quito residences in the city’s González Suárez area. The project features a metallic cloud-like structure on top, which has become a significant marker on the skyline.

Dutch designer Marcel Wanders collaborated with YOO on the Oh Quito, a two-tower residential development, which is nearing completion.

Bjarke Ingel’s firm BIG is also working on two Uribe & Schwarzkopf projects in Quito: a mixed-used tower called EPIQ, which is covered in pink, herringbone-patterned cladding, and the curved IQON tower, which is set to become the tallest building in the city.

BIG announced the Ecuador projects shortly after Moshe Safdie unveiled his project Qorner tower for the city.

A proposed 72-storey, mixed-use tower set to become the tallest in Niagara Falls was approved at a Council meeting in that city yesterday evening. The condominium and hotel tower at 6609 Stanley Avenue is set to rise 253.45 m high, surpassing the 56-storey, 177.1 m/581 ft north tower of the Hilton Niagara Falls, which has been the tallest building in that city since 2009.

Since news about the tower broke at the end of October, additional details and images have been released for the proposed landmark and its distinctive “bottle opener” design by Toronto-based Hariri Pontarini Architects, evocative of the 2008-built Shanghai World Financial Center. New renderings build off of the initial elevation diagrams, offering a better representation of the tower’s massing and exterior finishes.

Detailed renderings of the building’s bottle opener crown includes high-definition views of the upper amenities, set to include a 56th-floor “sky lounge” topped by a “sky garden” with an outdoor infinity pool, and a “sky link” aerial bridge. All of these spaces would overlook the Falls and the existing city skyline in the foreground, as well as distant views of the Toronto and Buffalo skylines on clear days.

Tuesday evening’s public meeting resulted in the issuing of amendments to the City’s official plan and zoning bylaw which allowed buildings as high as 30 storeys on that block. Around $2.7 million in community benefits are being implemented in exchange for the lofty 72-storey height.

The tower will feature a 456-room hotel on its lower half, with 275 residential units housed above. This infusion of density will help to mend a longstanding tear in the local urban fabric, with a two-storey concrete hulk from an earlier failed hotel construction project currently occupying the development site, which has sat vacant for 15 years.


The Toronto housing market continued to rebound in September, with prices rising the most in 21 months, bringing the cost of a typical home close to the record high set in 2017.

The benchmark price across all types of homes rose 5.2 per cent from a year earlier to $805,500, the highest annual rate of growth since December 2017. That’s about $10,000 short of the record set more than two years ago when soaring prices prompted a series of government policy changes to cool the market. Prices were driven higher by a decline in supply, with active listings down 14 per cent to 17,254.

Sales in the Toronto region jumped 22 per cent to 7,825 units from the same period last year, the Toronto Real Estate Board said Thursday. All housing segments saw double-digit gains, led by a 29 per cent sales jump for detached homes. Sales were well below the record set in September 2016 of more than 9,800, and on a seasonally-adjusted basis, sales fell 0.3 per cent from August.

The average price of a home in Toronto rose 5.8 per cent to $843,115, the highest price this year, though well below the peak of almost $921,000 set in April 2017.

Demand for homes in Canada’s biggest city continues to grow amid lower interest rates and a crunch in supply thanks to strong immigration flows. Buyers have also adjusted to stricter mortgage-lending rules put in place to cool the market. Sales in Vancouver rebounded 46 per cent last month after a policy-driven slump, though prices continue to dip.