For Maclean’s eighth annual chartstravaganza, we’ve once again asked dozens of economists and analysts to ponder the year to come, and choose one chart that will help shape Canada’s economy in 2022 and beyond, and explain this outlook in their own words.

This year, we’ve decided to release the charts over several days, making this more of a Chart Week than a one-day data binge. We also cover jobs and income, inflation, COVID, and energy.

How we’ll weather higher interest rates

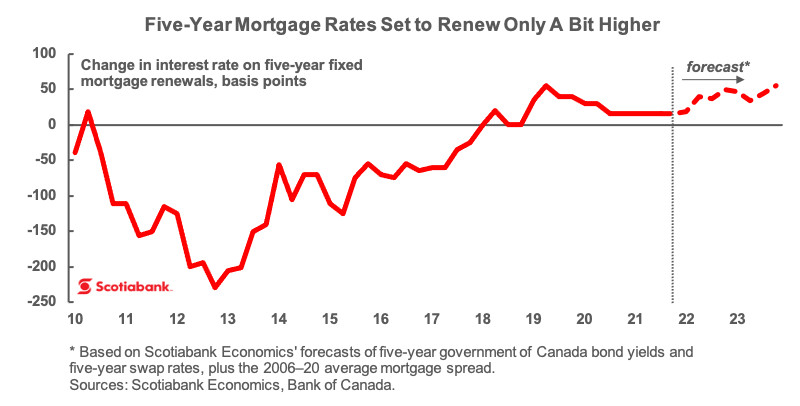
Canadian households and housing markets can weather the interest rate increases the Bank of Canada is widely expected to deliver next year. At present, fewer than half of Canadian households have mortgages or home-equity lines of credit (HELOCs). About 75 per cent of existing mortgages are locked in at fixed rates, while the much smaller stock of HELOC balances carries floating rates. Scotiabank Economics expects holders of the most popular five-year term mortgages that renew in 2022 to see their rates increase by an average of 36 basis points (bps), which translates into about $50 a month in additional payments on the current average outstanding loan balance of $241K. Renewals in 2023 are forecast to see rate increases of about 45 bps, or around $65, in additional monthly payments. While no one wants to pay more on their mortgage, Canadian borrowers are set to absorb higher rates: under federally mandated stress tests, they had to show that they could cope with rates around 180 bps higher when they contracted mortgages nearly five years ago on larger principals.

New mortgages taken out during 2021 have been stress-tested against an even tougher standard: borrowers have had to show they could handle a 5.25 per cent interest rate, about 250 bps over five-year fixed rates and some 380 bps over variable rates on offer in December 2021. Although the share of variable-rate mortgages in new originations soared in 2021, they still account for only about one-quarter of all mortgage balances outstanding. Under most variable-rate terms, rising rates don’t trigger immediate increases in monthly payments; instead, amortizations are lengthened. Where higher interest rates do mean larger current debt-servicing costs, mortgages can generally be converted into fixed-rate loans.

Canadians are ready for a return to normal interest rates.

Inflation is behind home price growth—way behind

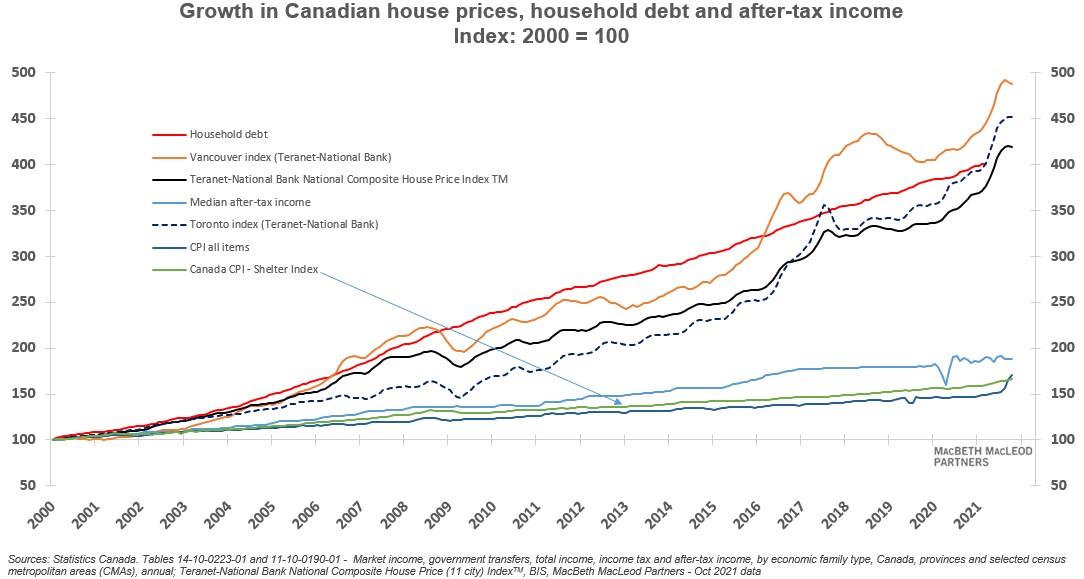
Canada’s housing bubble has grown into a massive problem for the Canadian financial system. House prices are much higher here than in most other countries, and levels of household debt incurred to keep up with the bubble are now a major risk.

One of the less well-known aspects of the bubble is its lack of upward pressure on inflation and the consumer price index, even as house prices have soared.

This chart shows that house prices in Toronto, Vancouver and nationally have grown about 4.25 to almost five times, with household debt keeping pace. That rate of increase is above seven per cent per year. Yet, the CPI measurement of housing costs known as “shelter” (shown in green with the arrow) has only inched ahead, growing by about 1.6 times. Most of the time that growth has been less than two per cent per year.

You might ask how this happened, especially since “shelter” is the largest weight component of CPI. Statistics Canada uses a monthly payments approach to measuring housing costs. The cost of buying a home is not included. A key part of the monthly cost of housing for owned accommodation is the mortgage payment, comprising principal repayment and interest. And interest rates have declined steadily over the last two decades, keeping the house-price bubble alive but holding the cost of shelter to a smaller gain.

The irony is that as the Bank of Canada increases interest rates, starting next year, house prices might drop, yet the CPI measurement of housing costs will grow, as the rate of interest is a significant weight in the calculation.

Housing construction will simmer down in 2021; will business step up?

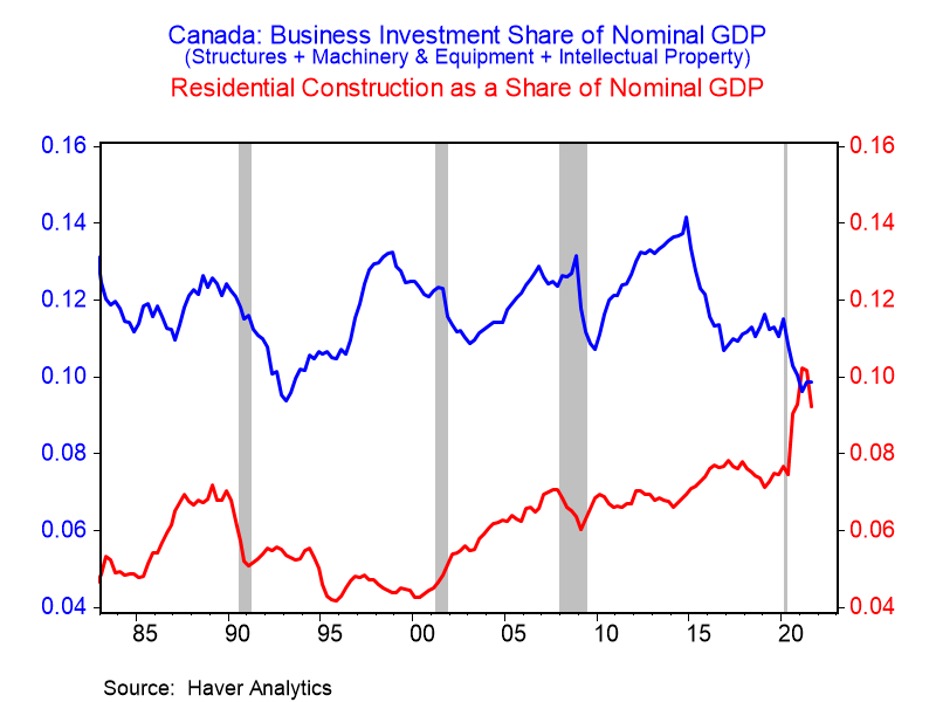
Amid the many staggering economic statistics that emerged from the pandemic, this may be the most staggering: in the first three quarters of 2021, residential construction accounted for a larger share of Canadian GDP than did business investment. That has never happened before, not even close. In the 50 years prior to the pandemic, business investment was typically about twice as large a share of the economy as housing—a “normal” year would see about 12 per cent devoted to private capital spending and six per cent to residential construction. (Statistics Canada includes new homebuilding, renovation activity and real estate agent fees in the latter.)

The crossover in 2021 speaks to both (a) very weak business investment (tied with 1993 as the lowest on record), and (b) very strong housing activity (a record high share). Because all of these figures are stated in current or nominal terms, sizzling home prices played a role in the ballooning housing activity. But even in real or inflation-adjusted terms, housing’s share of activity would still rival the late 1980s for the strongest on record.

Looking ahead, housing is expected to simmer down from the 2021 extremes, and it was already easing from the early-year fireworks. The bigger question mark for the Canadian economy is whether business investment can now step up—we suspect it will, but look for only a moderate near-term recovery. Canada’s heavy dependence on housing doesn’t look to end anytime soon.

Stoking the home shopping spree

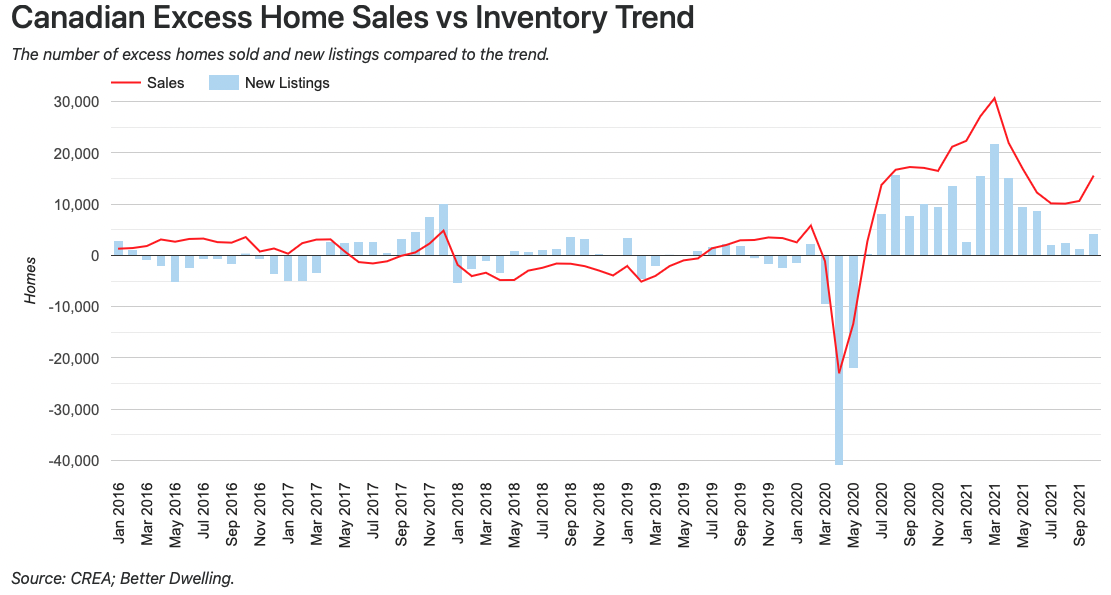
There has been a lot of focus on a lack of housing inventory, but little focus on the real issue—excess demand. When the Bank of Canada (BoC) cuts rates and uses quantitative easing, they’re looking to stimulate demand to raise inflation. The mechanism of lowering rates pulls consumers forward, to compete with existing buyers. Higher competition for the same lot of goods means more inflation.

That’s what’s happening with real estate. From April 2020 to October 2021, Canada saw about 246,500 excess home sales above the trend. In contrast, new listings came in higher, but just 85,800 homes above trend—far lower than the boost in home sales.

Separately, BMO estimates the annualized dollar value of excess home sales to be around $150 billion. It’s about the equivalent of six per cent of Canada’s GDP. That’s not total sales, it’s just the excess above the trend, stimulated by cheap credit. Keep in mind, this is happening with virtually no population growth.

The BoC stimulated demand to raise home sales and inflation, and now pretends it has no idea where it came from. Golly gee whiz, what a mystery.

Single-family homes are becoming precious commodities

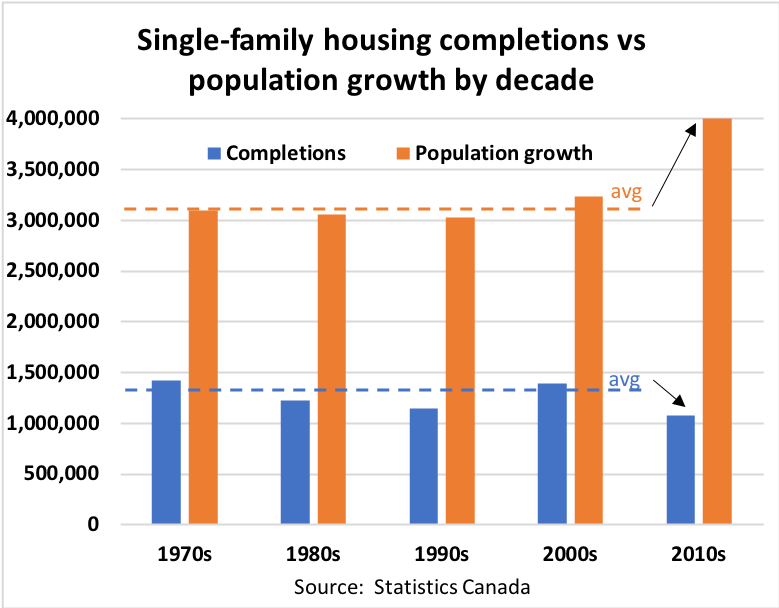
The number of single-family homes listed for sale in major metropolitan areas across the country has fallen precipitously in recent years. In the Greater Toronto Area, listings have fallen 52 per cent compared to last year and are down a stunning 77 per cent from 2017 levels. In Vancouver, it’s a similar story, with inventory down by nearly one-third compared to last year and by over half since 2018.

While excess demand and speculation are no doubt contributing factors to this decline, the main driver appears to be a shortfall in new construction in the past decade at a time when population growth was exceptionally strong. From the 1970s until the 2000s, population growth averaged about 3.1 million per decade while new single-family completions averaged just under 1.3 million. But in the 10 years from 2010 to 2019, population growth surged to four million, while new completions fell to less than 1.1 million.

Until Canada figures out how to right this imbalance, we can expect single-family homes to be coveted assets in major markets across the country.

The Greater Toronto Area is one of the hottest regions in the Canadian housing market and has been for a long time. With so much attention from buyers and investors, the ever-pressing question is how the market will perform in the coming months and years.

Despite difficulties stemming from pandemic conditions in the past two years, price growth has stayed strong in the GTA, continuing its decades-long climb. Can we expect a continued fast pace of growth in house prices, or will things slow down? Will we see a large price correction in the coming years?

In this article, we will explore some of these questions and get a better idea of what the future may hold.

The current state of the GTA housing market
It should be no surprise to anyone paying attention that the housing market in the GTA is growing at a rapid pace. For over a year now, markets in the GTA have continuously reported record-breaking months and record-high house prices. At the same time, housing stock in the GTA has hit dismal lows. Today, the GTA is one of the most expensive of all Canadian housing markets.

Average prices in the GTA
In November of 2021, the average price across the GTA rose to $1,163,323, up from $955,889 at the same time last year. In terms of market activity, the region recorded over 9,000 home sales and only 10,036 new listings.

In this month, the price of single detached homes edged above $1.5 million, a 30% increase year over year. The semi-detached and condo segments saw average prices of $1,206,016 and $715,104 respectively. That means condos now in the GTA cost around the same that an average single-detached home did in 2014.

With sales up since this time last year but listings down, the GTA has remained firmly within seller’s market territory and the Toronto Regional Real Estate Board (TRREB) is calling attention to “an inherent supply issue across all home types in the Greater Toronto Area.”

Though home price appreciation continues in the GTA, price acceleration has begun to slow, indicating a cooling off from rapid price gains of mid-2020.

What might the future hold?
As indicated by the statistics above, there are a few things that are driving the real estate market in the GTA. Firstly, the area has a lot of economic momentum. Not only is it Canada’s most populated region, but it’s also a hot spot for industry, business, and jobs. It sees huge amounts of yearly investment from both domestic and international sources, as well as steady population growth.

This can to some extent explain the high levels of housing demand in the GTA housing market. Simply put, people want to be where the action is. This is coupled with the fact that supply is so low in the city. In the past years, active supply in the market has dwindled, with homes being bought up about as fast as they can be put on the market, contributing to tight market conditions.

Demand can be reduced in a few ways. One major way would be to push buyers away from the housing market, while another would be to actually satisfy demand with a proportionate amount of housing supply. Unfortunately, even with large increases in housing seen in the GTA in the last year, it is unlikely to make enough of a dent to significantly impact housing affordability.

In terms of reducing demand, there is hope that an increase in interest rates could ease demand and slow price acceleration. In addition, upcoming regulations such as limiting foreign purchases and a vacancy tax are intended to help reduce demand as well. However, the actual effectiveness of these changes is contentious and remains to be seen.

With the forecasted end of pandemic conditions in 2022, other factors may keep demand high in the GTA, such as many people returning to work in the city, returning post-secondary students and increased immigration.

With more population growth and increasingly unfavourable detached homes, the condo segment, which has seen relatively slower increases in price, may see sales and values continue strong in the coming years.

Overall, opinions are mixed among economists and real estate professionals on what the future holds for the GTA and for Canada’s housing market. In general, it seems the market will continue strong or steady through 2022, with the potential for a small price correction. Though given the recent increases in home prices, even a significant correction would only see prices return to the still high values of a few years prior.

In its recent Housing Market Outlook report, the Canada Mortgage and Housing Corporation predicted continued price growth through to 2023, though at slower rates than seen recently.

Buying or selling in the GTA today
In terms of buying, many are trying to get in now before an impending increase in interest rates makes large mortgages moderately less affordable. If you are waiting for lower prices before buying, however, you may be out of luck.

For sellers, you can be assured your house will sell easily, and for a good amount of money if you choose to list it. But should you? With property in the GTA being so hard to come by, and its years-long trend in appreciation, values in the market will likely remain strong for at least a few years to come. However, if you want to move your money elsewhere or buy in another city, you will find your money will go much further in other areas with better affordability.

It’s predicted that Canada’s home prices could soar next year thanks in part to pent-up demand and the median cost of a single-family house could reach more than $900,000.

According to the new Royal LePage Market Survey Forecast released on December 15, home values in Canada are expected to “rise strongly” in 2022 but at a slower pace compared to 2021.

The aggregate price of a home in Canada is set to go up 10.5% year-over-year to $859,700 next year.

Also, the median price of a single-family detached house is projected to increase 11% to $918,000 while the cost of a condo is predicted to rise by 8% to $594,000.

Royal LePage has cited pent-up demand from people who weren’t able to buy a home in 2021 along with the “growing need” for more properties as the reasons for the increases.

It said that these factors put upward price pressure on the market that’s already dealing with a supply shortage.

Locally, the greater areas of Toronto and Vancouver are expected to see the highest aggregate price increases at 11% and 10.5% respectively.

The Greater Toronto Area is the only region in Canada where condo price increases could overtake the rising costs of detached homes as the figure is forecast to go up by 12% year-over-year in 2022.

A report from the National Bank of Canada laid out how much money you need to be making to afford a house in cities across the country, with people in Toronto and Vancouver needing to earn over $200,000 annually and save for decades to get a house.

While it might not seem like it, a recent ranking actually found that Canada is one of the most affordable places in the world to buy a home.

After many months of home prices surging to never-before-seen highs, there’s no relief in sight for Toronto next year.

According to the new Housing Market Outlook from RE/MAX, home prices in the province’s capital are expected to rise another 10% in 2022. In larger markets like Toronto, the report says, there’s a chance that increased immigration next year will weigh on the already low supply levels and high home prices.

Interestingly, many of Ontario’s smaller markets are expected to have just as big, if not larger, price increases next year. Muskoka is projected to see prices rise by a whopping 20%; meanwhile, Thunder Bay and Collingwood/Georgian Bay are expected to have a 10% increase.

Durham, which saw a staggering 29% price increase year-over-year from 2020 to 2021, is projected to see a comparatively modest 7% increase in 2022. Brampton’s home prices, after a 25% year-over-year rise, are expected to go up 8% next year.

According to the report, inter-provincial migration will continue to be a key driver of housing activity in regions all across Canada.

“Less-dense cities and neighbourhoods offer buyers the prospect of greater affordability, along with liveability factors such as more space,” said Christopher Alexander, President of RE/MAX Canada. “In order for these regions to retain these appealing qualities and their relative market balance, housing supply needs to be added. Without more homes and in the face of rising demand, there’s potential for conditions in these regions to shift further.”

We knew it was coming. But it’s important and worth mentioning again. This week, Toronto City Council adopted new Zoning Bylaw Amendments that will remove most parking minimums across the city. We now join many other cities across North America who have done similar things in order to try and encourage more sustainable forms of mobility.

If you’d like to take a spin through the draft amendments, you’ll find them linked here. I haven’t gone through them in detail, but I did do a word search for “maximum” given that this week’s adoption represents a pretty clear change in perspective. Here’s an excerpt from the staff recommendation report that speaks to what I’m talking about:

Recognizing these challenges, this review of the parking standards in the city-wide Zoning By-law 569-2013 was guided by the principle that parking standards should allow only the maximum amount of automobile parking reasonably required for a given use and minimums should be avoided except where necessary to ensure equitable access. The previous review, which began in 2005, was guided by the principle that the zoning standards should require the minimum responsible amount of parking for a given land use. This is inconsistent with Official Plan policies which discourage auto dependence.


One other thing I found in the documents that went to Council was this map of parking spot selling prices in active high-rise developments across the city. Not surprisingly, downtown and midtown are showing the highest prices per parking space. I can’t vouch for the accuracy of all of these dots, but it looks directionally right and I can tell you that at least one of them is correct.

All of us in the industry know how much parking drives decision making. There’s a joke (half-joke) that when you’re designing a building, first you lay out the parking and then you design all of the residential suites around that structural grid. That’s not the way things should be done. The future of this city should not and cannot be centered around the car. This week’s adoption is in service of that.


Toronto home prices rose to a record as a sharp decline in the number of properties coming up for sale stoked competition among buyers, leaving little prospect the market will cool soon.

The average price of a home sold in the Toronto region in November was $1.16 million, up 22 per cent from last year. The number of new listings fell 13 per cent, according to data released Friday by the Toronto Regional Real Estate board.

Ultra-low mortgage rates, an open immigration policy and demand for larger living spaces in the pandemic have combined to created a homebuying frenzy that has made Canada one of the hottest housing markets in the world. Now, with the central bank signalling that interest rates could rise as early as April, buyers are finding incentives to try to get in the market now.

But there’s little to buy. There were about 6,100 active listings at the end of November — fewer than half the 13,800 on the market a year earlier.

The real estate board said that without policy measures, there won’t be enough new housing built to correct the supply-demand imbalance.

“Governments at all levels must take coordinated action to increase supply in the immediate term,” Kevin Crigger, president of the Toronto real estate board, said in a press release accompanying the data. “Unless governments work together to cut red tape, streamline the approval processes, and incentivize mid-density housing, ongoing housing affordability challenges will escalate.”

Though the cost of homes became an issue in the September election that returned Prime Minister Justin Trudeau to power, many of the levers that could increase the housing supply in Toronto and elsewhere lie with zoning and development rules controlled by local and provincial governments.

The drop in listings meant the total number of sales slipped 2.5 per cent on a seasonally adjusted basis from the month before. The average length of time a property stayed on the market was just 13 days. The data include the urban core of Toronto and its suburbs.

Sales of all types of ground-level homes registered fewer sales in November, but transactions for condominiums, which had gone out of favour last year after COVID-19 hit, surged 42 per cent as pickings among other property types grew slim and higher immigration flows bring the prospect of more potential tenants for units that are rented out.

Source: Bloomberg