What is the money supply (M2) of Canada in 2023? How will it impact you and your wealth?

Canada M2 Money Supply is at a current level of 2.410T, down from 2.412T last month
Referring to Collecting the helicopter money model (monetary tightening by raising the interest rate).

Central Banks are Creating Paper money from the thin air….. = Paper money (Fiat Money) = toilet paper
Owning Assets : GOLD , SILVER, Real Estate is more reliable than fiat money

What was Canada’s Money Supply M2 in Jun 2023?
Canada Money Supply M2 was reported at 1,821.669 USD bn in Jun 2023 See the table below for more data.

How does M2 money supply affect the economy?
It provides insights into the potential inflationary pressures, economic activity, and the overall health of financial markets. An increase in M2 money supply can stimulate economic growth and investment by making more funds available for lending and spending.May 16, 2023

What happens when M2 increases?
As a result, M2 offers a more comprehensive overview of inflation levels because if the M2 monetary supply is increased, inflation could rise. Equally, if M2 supply is restricted by central banks, inflation could fall.

Here’s the REAL reason why income inequality keeps rising in Canada

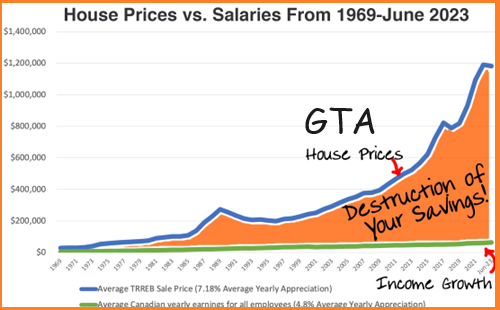
The gap between income and house prices has been steadily growing since the 80s.

And it’s not slowing down.

Because the real reason house prices are going up while wages are down?

is a little something called ‘M2 supply’ (aka the amount of ‘new’ money added to the economy).

Compares GTA house prices to M2 supply:

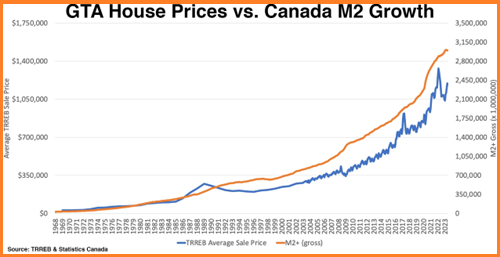
Almost perfect correlation between the amount of new money added…and the average house price in the GTA.

  • How does this all impact you as a hard-working Canadian?
  • How does it impact your kids who might want to purchase their own home one day?
  • Where will house prices go up from here? And will “higher for longer” interest rates really make a difference?
  • According to this chart, M2 supply (i..e ‘new’ money entering the economy) in Canada is going up again as of the last quarter!

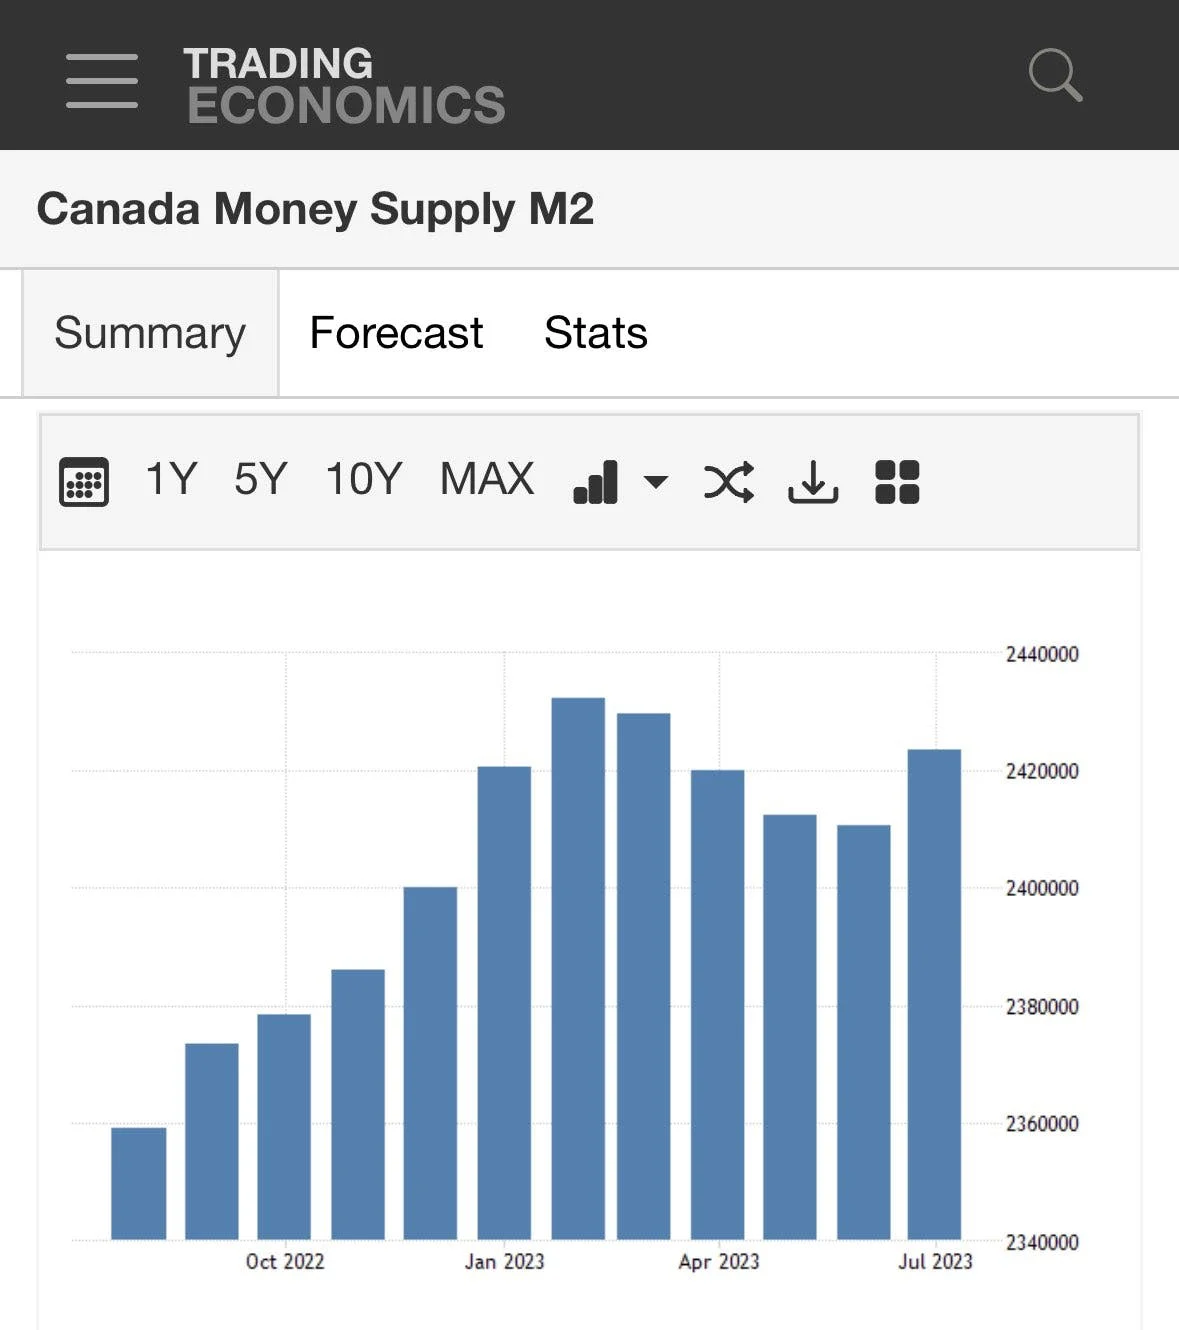
Despite the higher rates:

This means home prices could also stay high…if not go up again.

  1. What’s going on behind the scenes?
  2. What does the Bank of Canada have planned for rates, and where might they go over the next 12-18 months?
  3. Where will M2 be headed and what factors might force the Bank of Canada’s hand into pumping new liquidity into the economy again?


GTA New Condo Prices by Month

Average Greater Toronto Area New Condo Asking Prices

  • Average GTA new condominium apartment asking prices per-square-foot are up 63% since 2018, but down 8% annually to just under $1,500 psf in August.
  • The average end-selling price was $1.33 million for a new condo in the GTA in August, down 21% annually.
  • We are yet to see a lot of high-rise developers lower pricing in 2023, instead choosing to offer incentives to move product. With that said, the most successful launches are coming to market at 2021 price levels, pulling the overall average price down.

New Condo Price Growth by Municipality & Year

Year-Over-Year Change in New Condo Pricing by City

  • Six municipalities experienced annual new condo price growth per-square-foot of over 25% in 2022, with Kitchener and Waterloo topping that list at 45% and 44%, respectively. Previously viewed as tertiary markets, the KW region is now valued more like a GTA suburb.
  • In the City of Toronto, new condo prices rose 5% annually in 2021 and 13% annually in 2022, but have fallen 2% year-to-date this year (ending August 2023).
  • The municipalities with the highest price growth in 2023 are primarily markets with limited launch activity in 2022, and based on fairly small sample sizes.

Historical Investor Returns – Select East Toronto Projects

Launch Pricing versus Resale Pricing

Bullpen Consulting Pulled Data on the Average Price of New Condos Launched in East Toronto and Scarborough, and Compared them Against Average Resale Prices from September 2022 to August 2023.

  • There are five high-rise projects analyzed in Scarborough in the chart above. These projects have seen pricing increase by just under 80% on average from launch, an average annual return of 11%.
  • There were 16 mid-rise projects reviewed, with data showing that these projects have increased in value by 73% on average or 9% annually.

Average Rent at GTA Buildings Completed since 2014

Quarterly Average Rent and Rent Per-Square-Foot

  • When considering condominium and rental apartments completed over the last 10 years in the GTA, the average asking rent was $3,184 in Q3-2023 (July and August only) based on a sample of listings data, compared to $3,085 per month in the fourth quarter of last year (+3%).
  • On a per-square-foot basis, these condo and rental projects that are less than 10 years old are asking approximately $4.43 psf in rent in the third quarter, compared to $4.20 psf in Q4-2022 (+5%).
  • In should be mentioned that the average unit size is falling (719 sf vs 735 sf), contributing to the increase in per-foot rent levels. The median unit size in Q4-2022 was 702 sf, compared to the median unit size in Q3-2023 of 669 sf.

Average Rent at Recently Completed PBR Buildings in the GTA

Quarterly Average Rent Per-Square-Foot for Select “Newer” Purpose-Built Rental Apartments

  • These 20 buildings (high-activity projects completed over the last 10 years) were asking about $4.16 psf on average for rent in the second quarter of 2023, versus $4.37 psf in Q3-2023.
  • One of the newest developments to start their lease-up program is Maple House at Canary Landing, with asking rents of approximately $4.75 psf.

Condo Launch Prices versus 2023 Rent Levels – New Completions

Condo Launch Prices Per-Square-Foot versus Average Rent Per-Square-Foot (2023 Completed/Registered Condos)

  • The average asking rent per-square-foot at these 2023-completed condominium apartments in southwestern Ontario is $3.89 psf versus an average launch price of $805 psf. The rent represents 0.48% of the launch price (rent-to-price ratio).
  • Projects where rent is the highest versus the launch price is 0.73% at the Gaslight District Condos in Cambridge, and 71% at Rodeo Drive Condos in the Shoppes at Don Mills development in North York. There is “rent value” for lower-priced markets like Cambridge, while the rent value created at Rodeo Drive is due the the 7+ years from launch to occupancy.