
As ridership continues to drastically decline on both regional and local transit — 90% on GO transit and 80% on the TTC — while people work from home or self-isolate during the pandemic, it’s safe to say the public is moving around differently as the COVID-19 outbreak powers on.
To get a better understanding of the impact social distancing has had so far during the outbreak, Apple has released a mobility trends tool that pulls information from users of its Maps navigational app to provide a look at the change in the number of routing requests made within the Maps app for three modes of transportation: driving, walking, and transit.
The purpose of the Mobility Trends Reports tool is to provide Apple Maps data that may offer insights to local governments and health authorities looking for ways to slow the spread of COVID-19. Apple says the data could also be used as a foundation for new public policies by showing the change in volume of people driving, walking or taking public transit in their communities.
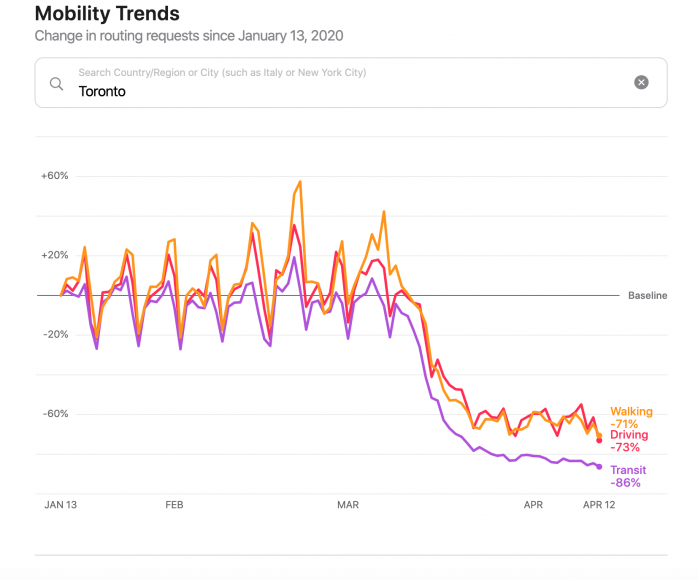
Apple says the new Mobility Trends Reports aggregates data from major cities and 63 counties or regions. You can use the online tool and search by country, region, or city to see specifics trends for an area. For instance, you can search “Toronto” to see that all monitored forms of transportation are down significantly, with walking down 71%, driving 73%, and transit by 86% since January 13, 2020.
The data is updated daily and can be found on Apple’s website or it can be downloaded in a broadly compatible CSV format.
As you would expect from Apple, privacy is at the forefront of the new Mobility Trends Reports, and the tech giant says the data is aggregated from Apple Maps and not associated with Apple IDs.


 Maziar Moini, Broker of Record - Home Leader Realty Inc.
300 Richmond St. W., #300, Toronto, ON M5V-1X2
Maziar Moini, Broker of Record - Home Leader Realty Inc.
300 Richmond St. W., #300, Toronto, ON M5V-1X2