Would you move further out of the city to secure the type of home you’re looking for within budget?

Given how popular work from home has been in the last few years, the option to choose home type first and city second is opening up to more buyers in Southern Ontario.

In fact, a Zoocasa survey early last year found that the pandemic has led to 32% of Ontario buyers purchasing a property in a location further than what they would have previously considered – and given the consistent price increases recorded across the province throughout 2021, it’s safe to say that trend has continued.

Buyers who have their eye on a certain type of home, whether that’s a condo in the city centre or a townhome with a yard for their dog, can save big if they can be flexible on which city in the Toronto Region they’d like to make their purchase in.

To help prospective buyers narrow down which areas they should consider focusing their house search in, Zoocasa has ranked the top five most affordable cities within the bounds of the Toronto Regional Real Estate Board to buy a detached home, semi, condo townhouse, and condo apartment based on November 2021 sales data*.

In other words, if finding the right type of home at the right price point is more important to you than buying in any particular city, this report is designed to help you discover which cities to consider in your home search.

Brock is the Most Affordable Place to Purchase a Detached Home


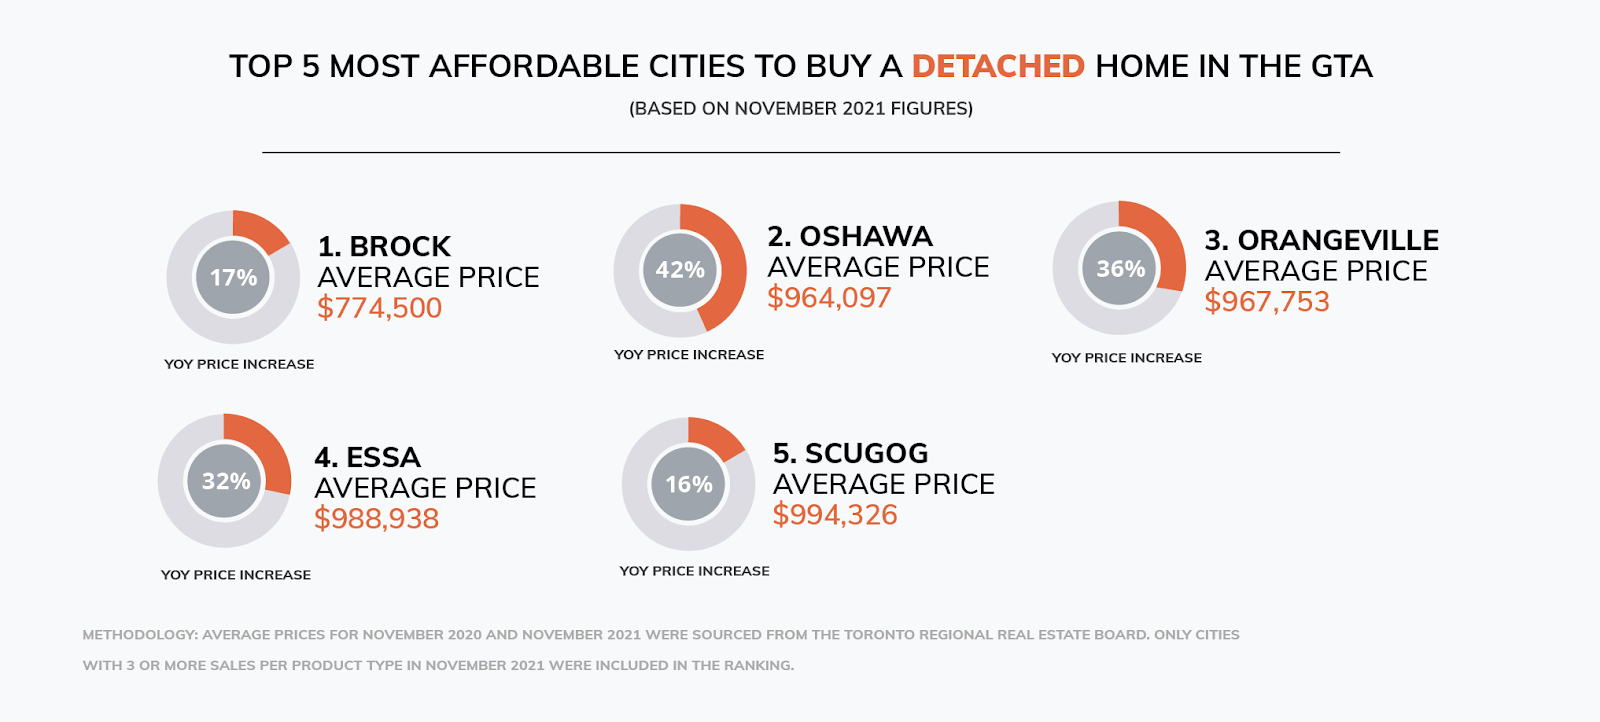
Although the average price for a detached home in the Toronto Region hit $1,567,832 near the end of last year the top five most affordable cities to buy a detached home in the greater region all clock in with an average price under a million dollars – a significant savings of more than $500,000.

Brock, the most affordable city on the list, is a small town in the north end of Durham township. As of 2016, the population reached just over 11,000 – making it a great choice for buyers looking for more space and a small-town lifestyle.

With an average price of $774,500, detached homes here are half the price of the region’s average. However, affordability comes with a proximity tradeoff. Brock is located in the Toronto Region’s farthest north reaches, and nearly borders Lake Simcoe. In good traffic conditions, you can reach Union Station by car in a little over an hour and a quarter, but Barrie and Peterborough are both closer cities – meaning you likely won’t want to commit to a daily, downtown Toronto commute if you’re living here.

If you’re looking to live a little closer to Toronto’s core, Oshawa and Orangeville both offer better connectivity to the rest of the GTA, with detached homes still coming in at an average price of less than a million. If you’re looking for small-town living, Essa (near Barrie) and Scugog (near Port Perry) are other options on the list that round out our top 5 most affordable places to buy a detached home in the Region.

Orangeville is Also the Most Affordable Place to Buy a Condo Townhouse

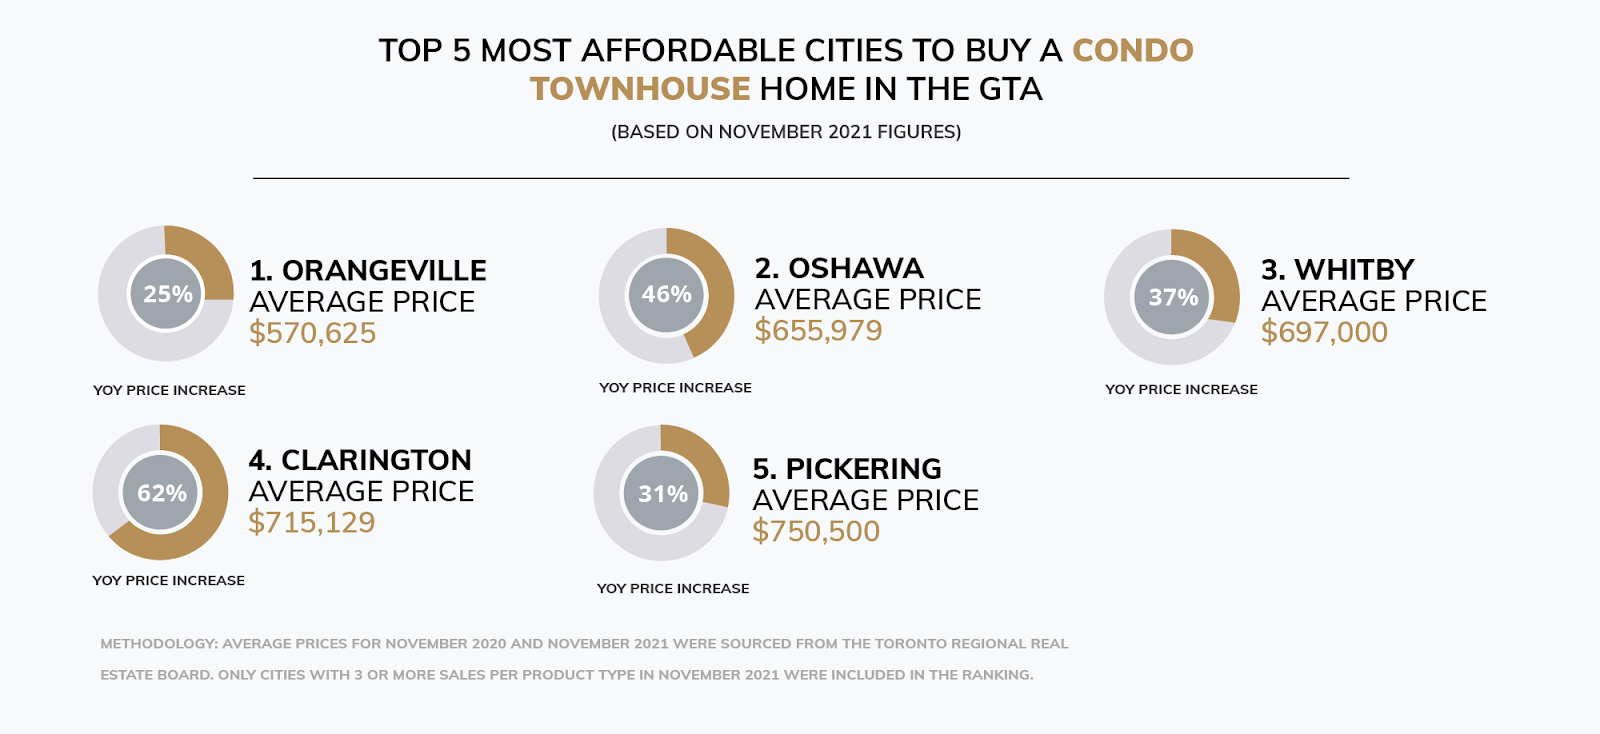
If things like multiple floors of living space and access to private outdoor space are high on your wishlist, a condo townhouse might be an affordable option for you to consider. Combining the higher-density building form and ownership structure of a condo, these homes are a great blend of space and affordability, especially for young families.

Regardless of your desired city, the average price in the Toronto Region is $826,475 for a condo townhome, which is well below the average price of all home types. When looking for the most affordable cities to choose from, Orangeville comes out on top again with an average price of $570,625 for this type of home.

The rest of our more affordable options come from Durham Region, with the cities of Oshawa, Whitby, Clarington, and Pickering rounding out the remaining spots on the list.

Oshawa is the Most Affordable Place to Buy a Condo Apartment

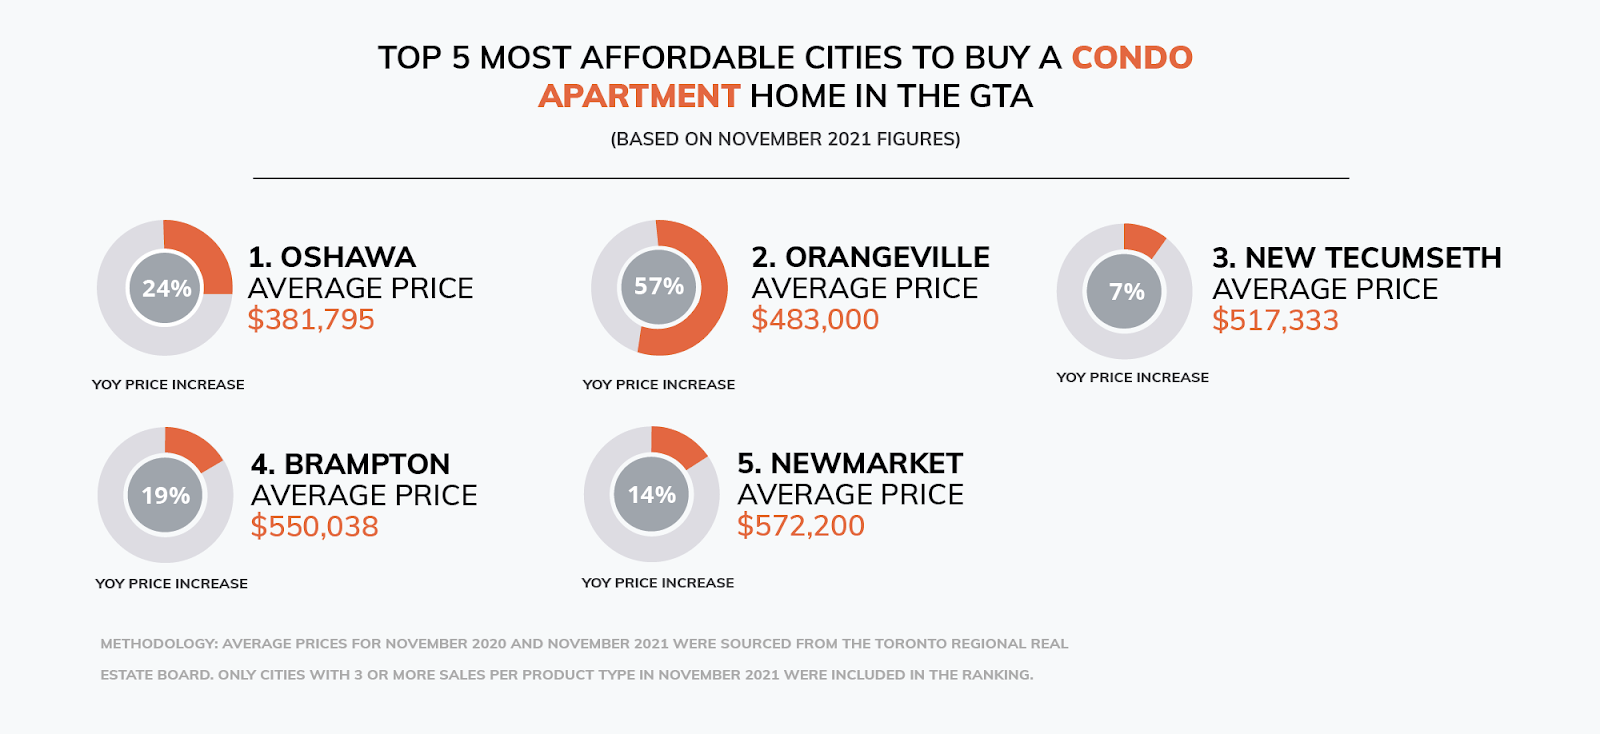
Condo apartments are one of the most affordable home types on the market in the Toronto Region today, with the average price as of November hitting $711,933 – a rate that comes in at over half the cost of the average detached home.

Within this category, you can find options with average prices under $400,000 if you consider moving to Oshawa, where the average price for a condo apartment was just $381,795 near the end of 2021.

Compared to some of the other cities that topped our list of affordability, Oshawa is considerably larger and more connected. With a population of 170,071 you’ll find more big-city amenities than what’s offered in Orangeville and Brock.

When it comes to your commute, you can make it downtown in 45 minutes by car in good traffic conditions, and taking public transit to work is a viable option with frequent GO Train service.

Other cities that top the list for the most affordable places to buy a condo apartment in the Toronto Region include Orangeville, New Tecumseth, Brampton, and Newmarket

What Do Buyers Need To Know About Moving Further Away From The City Centre?

According to Zoocasa Sales Representative, Allyson Neves, many of today’s buyers understand that being flexible on the location of their home purchase can help them check more boxes off of their wishlist

“Lately when I’m working with buyers, they’re coming to me with their top budget and wishlist for their home then asking me where they’ll need to move to marry the two. It becomes my job to help introduce them to new neighbourhoods or smaller towns that they may not have considered previously” she explains.

When working with buyers with this mindset, Neves starts the process off by understanding the non-negotiables. “It really comes down to knowing your price point first, along with anything else that binds you to a certain general location.”

“Usually buyers will come to me with a general bound for their location. This used to commonly be ‘no more than an hour from the office’. However, with work from home or hybrid options becoming the norm in many industries, I’m more often hearing ‘no more than an hour from my family’, or ‘I’d like to stay north of Toronto’. I compare this request with their budget and talk about which areas would be a fit for what they’re looking for in a property. From there, we start our house hunt. If you’re a buyer with this mindset, it’s helpful to work with an agent who really knows the general area you’d like to purchase in, they’ll be able to introduce you to some of the best places to consider during your search.”

While this report focused on the most affordable locations to purchase in the GTA outside of the city centre, this same mindset can still be applied for buyers looking outside of Toronto too. Neves, who is based out of Barrie explains, “as an agent that specializes outside of the GTA, it’s been a real pleasure introducing buyers who are new to the area to all that outside-of-Toronto living has to offer. Many are excited to trade city living for more space.”

Who doesn’t love a good map? Maps are so much more than just a nice-looking view of an area. They can be highly useful as a way to effectively display data about an area in a way that is immediately readable. In real estate, maps are crucial for all sorts of tasks like title searches, zoning, land surveys, and more.

In a city like Toronto, there is so much different variety between areas and one of the best ways to view these differences is through mapping. For investors, these maps present a quick and easy way to learn about areas in the city and compare them to one another. For example, if you are looking at an area to buy in, these maps could give you a better idea of the nearby area in detail and in less time than going for a walk around on the street. Let’s take a look!

Neighbourhoods map

This map gives you an idea of the many different neighbourhoods in Toronto today. From downtown Toronto to the edges of the city, each of Toronto’s 140 neighbourhoods has its own unique history and community. Learn more about each of Toronto’s neighbourhoods on the city’s website, or read our list of top neighbourhoods here.

Toronto city zoning map

This detailed map shows the various different zones in the city of Toronto. It can be pretty surprising to see just how much of the city mixes commercial, residential, industrial, and open space, and how some areas are distinctly reserved for one or two zoning types.

Crime maps

You might be wondering what crime has to do with real estate? Well, if you are looking to invest in a property, especially if you plan on renting out that property, crime rates can affect how desirable the neighbourhood is, and therefore how your investment may perform and how much rent you can collect. The Toronto police provide multiple interactive maps to keep you informed on where certain crimes are statistically more common and which areas are the safest of all.

Toronto transit maps

One of the biggest considerations for people looking to rent in the city is how they are going to get around. For many, public transit is the way they get around every day and is well connected to the rest of the city can save time and headaches. This Toronto map shows all the different subway, streetcar, and bus routes in the city. It’s amazing how connected we are!

Parks and trails

If you are looking to escape from the concrete and noise of the city, there are many public parks and trails that residents can enjoy – more than you might expect. The trick is in finding these areas. This handy map can help you find some greenspaces near you for when you need to get away close to home.

And many more

On the city of Toronto maps page and the open data directory, you can find many more maps for everything from tourist attractions to outdoor ice rinks (see above). This site is definitely a must-see for a map-loving Torontonian – though some maps may be more useful than others.

The January 2022 Market Update affirms Ontario’s historic commitment to modernizing the province’s public assets, including hospitals, highways, public transit, children’s treatment centres, courthouses and correctional facilities.

IO’s first Market Update for 2022 includes 39 projects, with 24 projects in pre-procurement and 15 in active procurement, totalling an estimated $60 billion in contract value.

The list also includes 14 additional government-announced projects in early stages of planning and determining the project’s scope, timing and delivery model.

IO continues ongoing productive discussions with the industry as we move forward on this large portfolio of projects and we are pleased to provide the latest information on changes in the procurement status of our projects.

Market Update – January 2022

A new year brings a new set of tax numbers, and here are the important figures you need to know for 2022.

Each year, most (but not all) income tax and benefit amounts are indexed to inflation. The Canada Revenue Agency in November 2021 announced the inflation rate used to index the 2022 tax brackets and amounts would be 2.4 per cent. This rate was calculated by taking the percentage change in the average monthly consumer price index data as reported by Statistics Canada for the 12-month period ended Sept. 30, 2021, relative to the average CPI for the 12-month period ended on Sept. 30, 2020.

Increases to the tax bracket thresholds and various amounts relating to non-refundable credits took effect on Jan. 1, 2022. Increases in amounts for certain benefits, such as the GST/HST credit and Canada Child Benefit, however, only take effect on July 1, 2022. This coincides with the beginning of the program year for these benefit payments, which are income tested and based on your prior year’s net income, to be reported on your 2021 tax return due this spring.

Tax brackets for 2022
All five federal income tax brackets for 2022 have been indexed to inflation using the 2.4-per-cent rate. The 2022 federal brackets are: zero to $50,197 of income (15 per cent); more than $50,197 to $100,392 (20.5 per cent); above $100,392 to $155,625 (26 per cent); over $155,625 to $221,708 (29 per cent); and anything above that is taxed at 33 per cent. Each province also has its own set of provincial tax brackets, most of which have also been indexed to inflation, but using their respective provincial indexation factors.

Basic personal amount (BPA)
This is the amount of income an individual can earn without paying any federal tax. You may recall the government in December 2019 announced an increase of the BPA annually until it reaches $15,000 in 2023, after which it will be indexed to inflation.

For 2022, the increased BPA has been set by legislation at $14,398, meaning an individual can earn up to this amount in 2022 before paying any federal income tax. The value of this federal credit for taxpayers earning more than this amount is calculated by applying the lowest federal personal income tax rate (15 per cent) to the BPA, making it worth $2,160. (Because the credit is “non-refundable,” it’s only worth the maximum amount if you otherwise would have paid that much tax in the year.)

But higher-income earners may not get the full, increased BPA since there is an income test. The enhanced BPA is gradually reduced on a straight-line basis for taxpayers with net incomes of more than $155,625 (the bottom of the fourth tax bracket for 2022) until it has been fully phased out once a taxpayer’s income is over $221,708 (the threshold for the top tax bracket in 2022). Taxpayers in the top bracket will still get the “old” BPA, indexed to inflation, which is $12,719 for 2022.

Government pension contributions
The Canada Pension Plan (CPP) rate for 2022 is 5.7 per cent (the Québec Pension Plan (QPP) rate is 6.15 per cent) with maximum contributions by employees and employers set at $3,499.80 ($3,766.10 for QPP) in 2022, based on the new yearly maximum pensionable earnings of $64,900 (with a $3,500 basic exemption.) Self-employed Canadians must contribute twice the amount, so their maximum CPP contribution for 2022 will be $6,999.60 ($7,552.20 for QPP), up from the 2021 amount of $6,332.90 ($6,855.80 for QPP).

The CPP hike is part of a multi-year plan approved by the provinces and the federal government five years ago to increase contributions and benefits over time.

EI premiums
Employment insurance premiums are also rising, with a contribution rate for employees of 1.58 per cent (1.2 per cent in Quebec) up to a maximum contribution of $952.74 ($723.60 in Quebec) on 2022 maximum insurable earnings of $60,300.

TFSA limit
The 2022 tax-free savings account (TFSA) contribution limit will remain at $6,000 for the fourth year in a row. That’s because the government in 2015 announced that, starting in 2016, the annual TFSA limit would be fixed at $5,000, indexed to inflation for each year after 2009, but rounded to the nearest $500. In other words, once the cumulative indexed annual TFSA contribution limit hits $6,250, it will jump to $6,500.

For 2022, that indexed contribution amount is $6,162.70, based on the 2.4-per-cent inflation factor above. But the limit for 2023 is expected to increase to $6,500, provided the 2023 indexation adjustment is at least 1.5 per cent.

The cumulative TFSA limit is now $81,500 for someone who has never contributed to a TFSA and has been a resident of Canada and at least 18 years of age since 2009.

RRSP dollar limit
The registered retirement savings plan (RRSP) dollar limit for 2022 is $29,210, up from $27,830 in 2021. Of course, the amount you can contribute to your RRSP is limited to 18 per cent of your 2021 earned income, which includes (self)employment and rental income, less any pension adjustments, up to the current annual dollar limit.

OAS
If you receive Old Age Security (OAS), the OAS repayment threshold is set at $81,761 for 2022, meaning your OAS will be reduced in 2022 if your taxable income is more than this amount, and is fully eliminated with taxable income over $133,141.

Working from home
Finally, a reminder that those of us who continue(d) to work from home in 2021 and 2022 will once again be able to take advantage of the temporary flat rate method, introduced for the 2020 tax year, to calculate home office expense deductions.

Under the temporary flat rate method, employees can simply claim $2 for each day they worked from home due to the pandemic. The government in December announced in its economic statement that it was increasing the maximum claim to $500 (from $400) for the 2021 and 2022 tax years.