Garrett Dash Nelson recently published a study looking at urban density on a cell-by-cell basis for a number of US cities. Each “cell” is a 30 arc-second grid cell, but you can think of them as being approximately one square kilometer. The goal of the project was to better define urban density and do it in a more granular way. City averages don’t tell you a whole lot about how neighborhoods vary, and they can be skewed by the denominator you use. i.e. Where are you drawing the urban boundary?
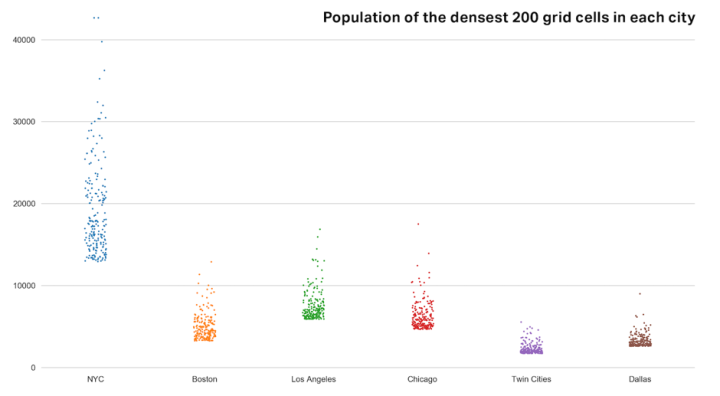
You can play around with his interactive study, here. Each city can be explored according to its 200 most dense cells. One interesting takeaway — though it is probably not all that surprising to this audience — is that New York City is really a unique place when it comes to American cities. If you look at the above chart (sourced from CityLab), you’ll see that most other US cities don’t come close to it in terms of urban density. New York’s 200th densest cell is still denser than the most dense cells of Boston, the Twin Cities, and of Dallas.
The y-axis is the total population in each grid cell.


 Maziar Moini, Broker of Record - Home Leader Realty Inc.
300 Richmond St. W., #300, Toronto, ON M5V-1X2
Maziar Moini, Broker of Record - Home Leader Realty Inc.
300 Richmond St. W., #300, Toronto, ON M5V-1X2