It won’t happen overnight, but with Toronto condo sales clearly on the rebound, struggling condo prices could soon be following them upward before the end of the year.

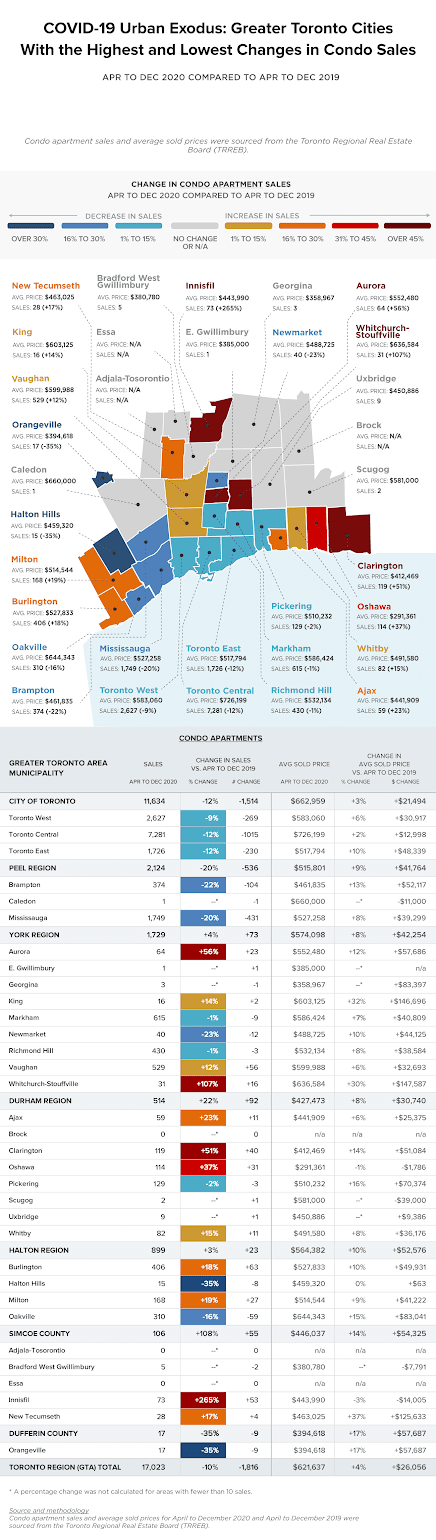
That’s the message from RBC Senior Economist Robert Hogue who, earlier this month, wrote that the Toronto condo market’s “relative affordability” may be boosting its appeal to homebuyers. This edge in affordability over single-family homes likely contributed to condo sales across the region rising over 85 percent in January.

“[T]he growing affordability advantage over single-family homes and the start of vaccination distribution (interpreted by some investors as a sign downtown condos will soon regain popularity) have rekindled buyers’ interest in condos over the past couple of months,” he wrote.

Hogue added that the ample condo inventory currently on the market is keeping prices stagnant for now, but sales activity picked up in December and continued to climb in January, suggesting condo prices could begin to “heat up” later this year.

While the ongoing surge in condo sales bodes well for prices seeing a lift before 2021 ends, the recovery has some headwinds to contend with before it can really take off.

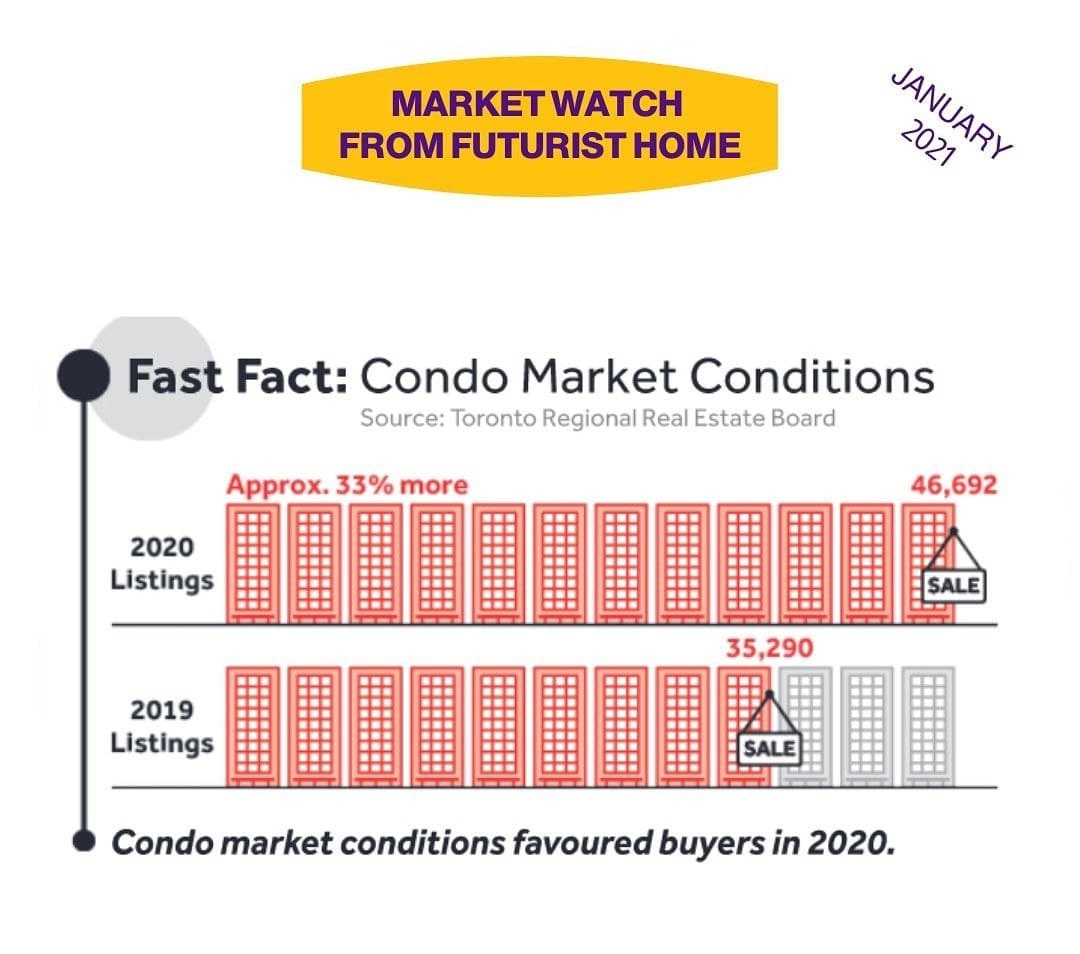
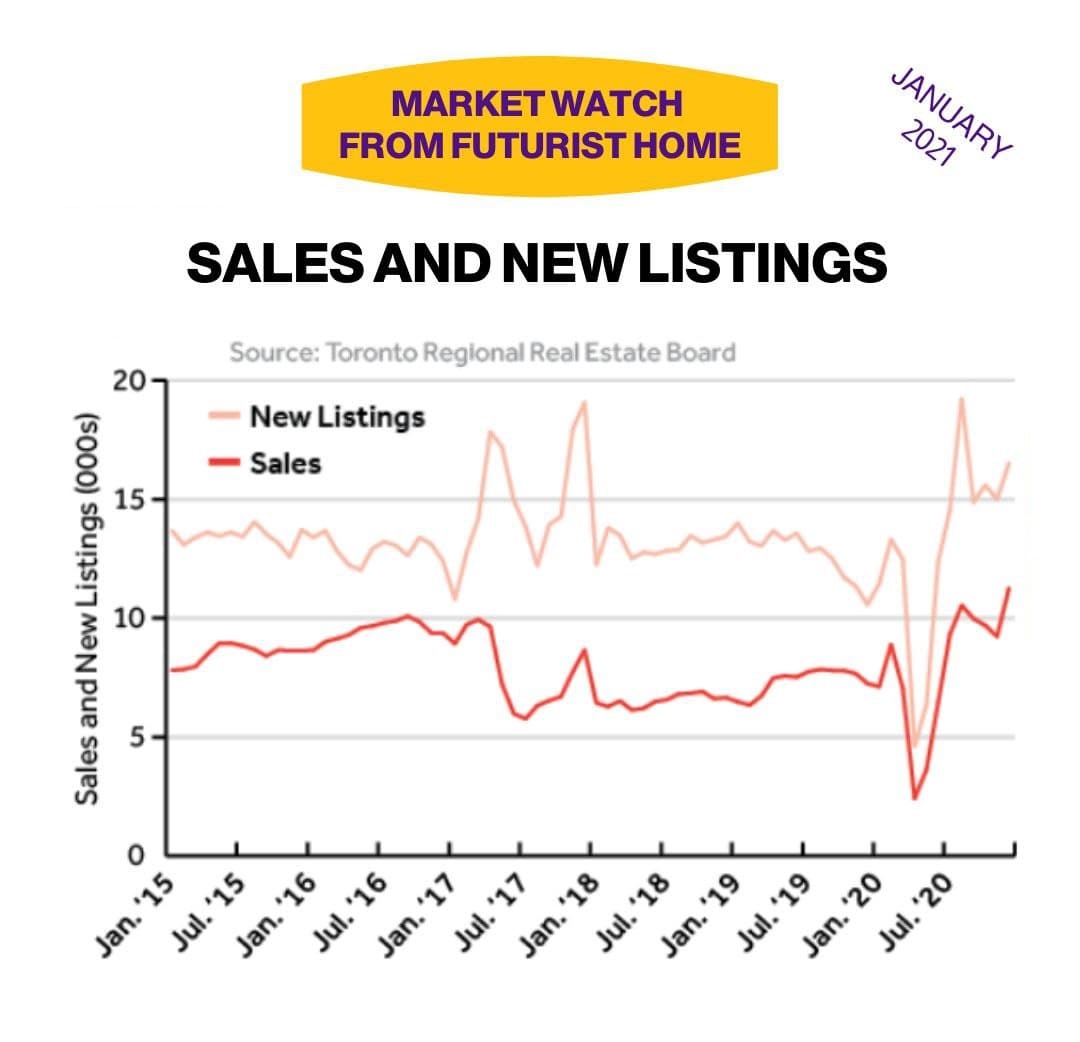
First, condo listings are still hitting the market at a rapid pace. Hogue acknowledged that active condo listings in Toronto rose by 85 percent in January, keeping “upward price pressure at bay for now.” That said, this is down from the staggering 177 percent annual increase in active condo listings recorded in November.

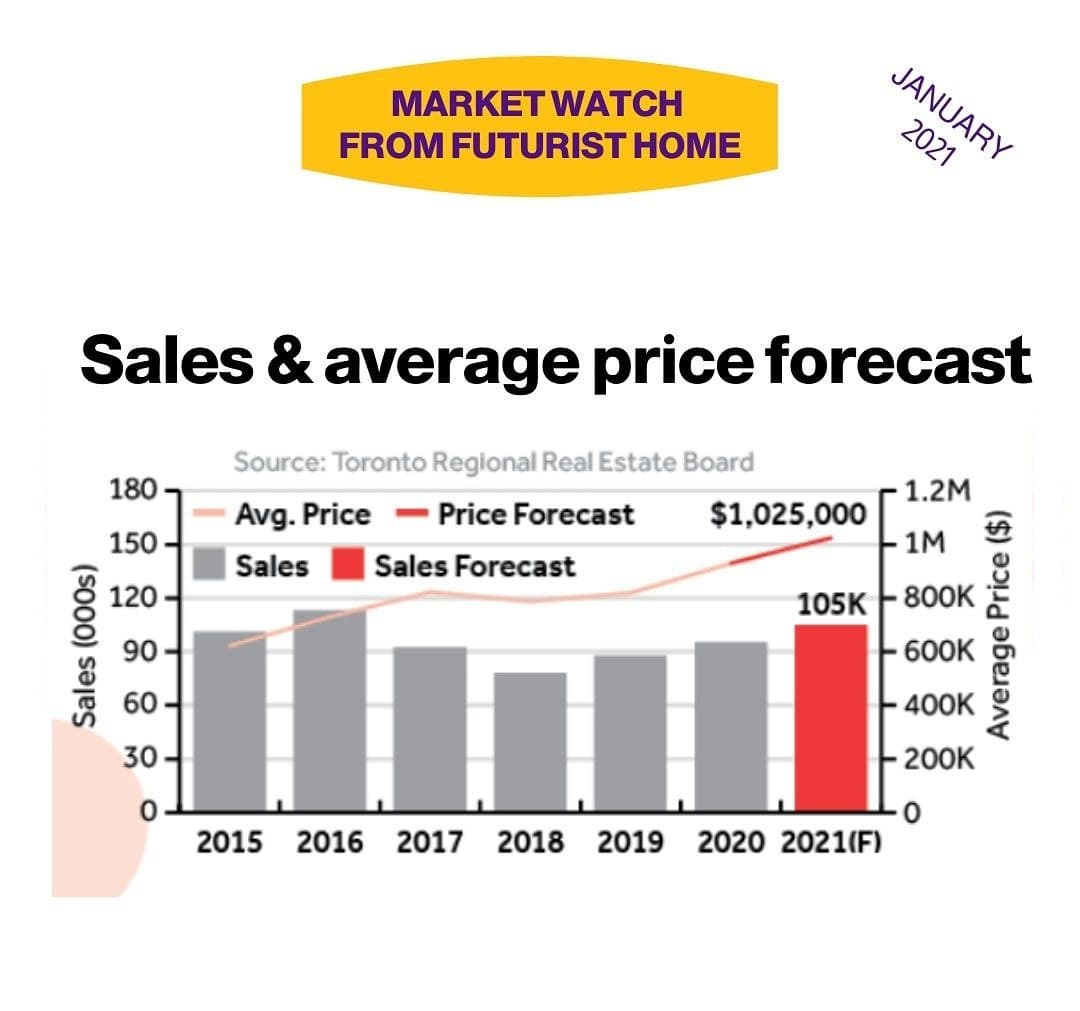
The Toronto Regional Real Estate Board (TRREB) forecast last month that the rate at which new condo listings are hitting the market would continue to decelerate into 2021’s second half, leaving room for strong buyer demand to push prices up.

But this begs an important question on condo demand: can it stay strong as Toronto’s rental market continues to see elevated supply and declining prices? Realosophy Realty President John Pasalis believes the outlook for the condo market hinges on how the rental market fares in the coming months.

Investors were partly responsible for the surge in condo buying seen in December and January, motivated by lower prices and a belief that rebounds in both the rental and resale condo markets were on the horizon in 2021.

This is by no means a sure bet.

“[I]f the rental market continues to soften, I suspect this may push investors back to the sidelines,” Pasalis said.

One of the big stories from fall 2020 that buoyed hopes for the Toronto condo market’s fortunes this year was the federal government initiative to boost immigration rates between 2021 and 2023. The plan is to welcome an additional 50,000 newcomers each year on top of existing immigration targets to make up for the massive disruption that played out in 2020.

New research from RBC Senior Economist Andrew Agopsowicz indicates the federal government is likely to fall short of this target, with an estimated 275,000 new permanent residents forecast to be welcomed to the country by the end of the year, far behind the 401,000 target.

With immigration being a key driver of population growth for the Toronto region, another shortfall in 2021 certainly won’t benefit the condo and rental markets.

As we creep closer to the one-year anniversary of Canada’s first COVID-19 lockdowns, the country’s major rental markets continue to see prices fall as rental supply climbs and empowered renters negotiate with landlords.

New figures released this week by rental site Padmapper suggest that February has been no exception, with rent prices for one-bedroom units in Toronto and Vancouver hitting a four-year low.

Prices for one-bedroom units in Vancouver declined by 0.5 percent monthly to $1,940, the lowest recorded price point since April 2017. Meanwhile, the city’s two-bedroom listings dipped by 0.8 percent on a monthly basis, down to $2,630. Year-to-year, rents for one-bedroom and two-bedroom apartments have dropped by 9.8 percent and 12 percent in Vancouver. Despite the declines, Vancouver continued to hold its first-place position as the most expensive city to lease an apartment in Canada this month.

Following closely behind, Toronto one-bedroom prices fell by 3.3 percent on a monthly basis to $1,770. Prices for one-bedroom listings have not been this low in the city since February 2017, when the average price was $1,700, the report explains. This price drop was slightly less pronounced than Toronto’s two-bedroom listings, which saw price declines of 5.3 percent monthly to $2,340. On a year-to-year basis, one-bedroom rents in the city are down 23 percent while two-bedrooms declined by 21.5 percent, the report noted.

In its findings, Padmapper attributed renter migration from Toronto and Vancouver as one of the driving forces of the continued price declines that have been commonplace in those two cities since the pandemic began.

“It seems the continuous rent price declines from renter migration out of Canada’s two most expensive rental markets have not stopped, even as COVID-19 vaccines have begun to roll out,” said the report.

In a sign that rental activity was slowing across much of the country, double-digit price increases were less frequently observed among smaller, less expensive cities too. Only four cities tracked by Padmapper recorded price increases in that range this month. Throughout 2020, renter migration away from large urban centres like Toronto and Vancouver drove prices higher in smaller, nearby cities where renters were relocating to.

Padmapper said that these dialled back rent price increases in those smaller markets were likely a result of a winter season lull in rental activity.

It’s still early in the year, but January 2021 is looking awfully similar to basically every month in the second half of 2020, at least as far as the country’s high-flying housing market is concerned.

While we started sounding like a broken record a long time ago, Canadian homebuyers did it again last month, turning out in record numbers to scoop up more properties than any previous January.

According to the latest Canadian Real Estate Association (CREA) data published this week, home sales last month were up more than 35 percent compared to a year ago and even came in two percent above the unusually busy December 2020 total.

Well over 60,000 home sales were recorded across the country last month, putting 2021 on pace for an annual sales total north of 736,000. For comparison, CREA’s 2021 forecast was for 583,635 homes to change hands across Canada. Market analysts at CREA don’t expect January’s fiery pace to continue, but it was, nevertheless, a remarkable start to the year.

“2021 started off just like 2020 ended, with a number of key housing market indicators continuing to set records,” said CREA Chair Costa Poulopoulos.

“The two big challenges facing housing markets this year are the same ones we were facing last year – COVID and a lack of supply. It’s looking like our collective efforts to bring those COVID cases down over the last month and a half are working. With luck, some potential sellers who balked at wading into the market last year will feel more comfortable listing this year.”

On the housing supply front, CREA noted that many Ontario markets saw sales decline on a monthly basis, indicating that the impact of record-low inventory levels is weighing down sales activity. The vast majority of markets across the country experienced annual home sales increases, but nine markets in Ontario with “extremely limited” supply even recorded annual sales declines.

CREA Senior Economist Shaun Cathcart said many buyers and sellers are “still waiting in the wings” for better weather and more clarity around whether recent improvements in the COVID situation can be maintained.

“It’s the dead of winter and we’re only just starting to get the second wave of COVID under control. We’re unlikely to see a rush of listings until the weather and public health situations improve, and we won’t see buyers until those homes come up for sale,” Cathcart said in a media release.

“The best case scenario would be if we see a lot of sellers who were gun-shy to engage in the market last year making a move this year. A big surge in supply is what so many markets really need this year to get people into the homes they want, and to keep prices from accelerating any more than they already are,” he added.

Canadian home prices also continued to surge in January, with the national average sale price rising nearly 23 percent annually and the MLS Home Price Index increasing 13.5 percent over January 2020.

Price gains aren’t expected to slow down anytime soon. CREA said the national sales-to-new-listings ratio — an indicator of whether the market is favouring buyers or sellers — rose to 90.7 percent, a record for the metric which was already deep into seller’s market territory. The long-term average for the ratio is 54.3 percent, according to CREA.

A Canadian home price tracker known to be one of the most reliable measures of appreciation just recorded its highest annual increase since October 2017.

The Teranet-National Bank Home Price Index rose 9.6 percent over the previous year in January, led by double-digit price increases in local markets including Ottawa-Gatineau, Halifax and Hamilton.

Montreal and Toronto also posted 12-month price gains above the national average, while five other major markets experienced increases between 0.8 percent and 9.1 percent. Of the 11 markets included in the index, only Calgary recorded an annual decline in its home price reading.

While the annual gains were robust, the January data, published today, pointed to an overall slowdown in Canadian home price appreciation. January marked the third straight month that the index recorded a lower price gain than the previous month.

After gaining momentum last August, the price index accelerated for several consecutive months before slowing down in November when it recorded a monthly gain of 0.9 percent compared to October’s 1.3 percent. The index slowed again in December with a 0.6 percent monthly increase. According to the latest reading, the index climbed only 0.3 percent in January compared to the previous month.

In commentary published today in response to the Teranet-National Bank data, Capital Economics’ Stephen Brown acknowledged the price appreciation slowdown may seem surprising, especially considering the national housing market is exceptionally undersupplied relative to strong homebuyer demand.

“With home sales at a record high in January, it is hard to make the case that the latest coronavirus restrictions are behind slower price growth,” Brown wrote.

“The explanation may simply be that, with house price inflation at double-digit rates in many cities, house prices already reflect the sharp fall in borrowing costs in the past year and so there is now much less scope for prospective buyers to bid up prices,” he continued.

Despite the apparent deceleration in price gains, Brown maintains that the limited supply of homes on the market will keep prices increasing “at a decent clip by pre-pandemic standards.”

Looking further ahead, he forecasts the Teranet-National Bank index will continue rising in the 10 percent range at the national level in the coming months before slowing to five percent later in the year. Brown writes that deteriorating housing affordability and rising mortgage rates will contribute to the slowdown.

Rock-bottom mortgage rates have been a major driver of red-hot home buying activity across Canada since the country emerged from the widespread lockdowns of spring 2020.

Those rates are likely to stay near all-time lows for the first half of 2021 but an economist with Capital Economics predicts they will begin climbing later in the year.

The firm’s Senior Canada Economist Stephen Brown wrote this week that mortgage rates could rise even though the Bank of Canada is expected to keep its influential policy rate at a record-low 0.25 percent until 2023.

Brown believes rates will increase before the Bank of Canada makes a move because Canadian bond yields are now forecast to rise this year and in 2022. A bond yield refers to the return that investors earn from holding bonds. In the world of finance, fixed-rate mortgages and bond yields are closely connected — when the latter moves in either direction, it typically has a parallel influence on the former.

According to Capital Economics’ updated yield forecasts, the five-year fixed mortgage rate could rise from its current level of 1.8 percent to anywhere from 2.3 percent to 2.8 percent, depending on how bank funding costs and lending spreads shift in the coming months. Simply put, a bank’s lending spread refers to the difference in the interest rate its borrowers are subject to and the rate that depositors are paid.

While that may seem like a lot of finance jargon to take in, as mortgage rates rise it could amount to a slowdown in home buyer demand, especially in hot, affordability-challenged markets like Toronto and Vancouver where single-family home prices have soared since mid-2020.

It’s unlikely, Brown writes, that home prices will be thrust into reverse if mortgage rates rise this year. Instead, expect national home price inflation to slow down from the 10 percent appreciation forecast for 2021’s first quarter to five percent by the end of the year.


By comparison, new listings dropped nationally by 2.9% y-o-y, with just 52,342 properties being added to the market last month. As such, the overall housing market was highly competitive for home buyers in January, as indicated by the sales-to-new-listings ratio (SNLR) of 70%. The SNLR is a measure of marketing competition during a defined period of time, and is calculated by dividing sales by the total number of new listings added to the market during that time. A number over 60% depicts a seller’s market: where demand outpaces supply and competition conditions favour home sellers over buyers.

According to CREA, as the spring market approaches, the current pace of home sales growth might be inhibited by an evident lack of supply, particularly in Ontario markets, to meet growing home buyer demand. However, CREA notes that new supply “could materialize as current COVID-19 restrictions are increasingly eased and the weather starts to improve.”

Prevalent market conditions in January also put upward pressure on home prices: the national average home price rose 23% annually in January to $621,525. To better understand where home buyers may find pockets of affordability, we took a closer look at the average home price in each of the 25 regional housing markets covered in CREA’s monthly report, and ranked every market based on the annual rate of growth of the average home price. We also identified where the average home price fell below and above the national average home price, and curated a list of example homes in each market that sold within a $20,000 range of the average home price.

Of the 25 regional housing markets included in CREA’s monthly report, 24 markets posted a y-o-y increase in the average home price, ranging from 5% to 41%, and just one market – Regina – saw the average home price decrease by 3% to $273,885. Further, 12 housing markets, or almost half of the areas included in the report, posted a growth in the average home price of at least 20%.

Average Home Price Below National Average in 18 of 25 Regional Markets Across Canada
Despite strong annual growth in the average home price in nearly every market, the average home price remained below the national average of $621,525 in 18 markets.

Saint John took the title of Canada’s most affordable housing market in January, despite an 8% increase in the average home price y-o-y to 199,853. On the other hand, Greater Vancouver recorded the highest average home price in January at $1,089,096 – an 11% increase y-o-y.

Despite tying for the highest increase in the annual average home price at 41%, the average home price in London and St. Thomas remained below the national average at $608,049. There was also a 41% increases y-o-y in the Niagara Region, however, the average home price clocked in at $651,138, nearly $30,000 higher than the national average.

Check out our infographic below highlighting the average home price in 25 regional housing markets across Canada, and where the average home price is above or below the national average. Further below find a sampling of home listings available in each region where the average home price is below the national average.


Sample Listings in Canada’s 18 Most Affordable Regions

1. London and St. Thomas

  • Average Home Price: $608,049
    Annual Price Growth: +41%
    What you could buy: 362 Ridout Street South
    List Price: $599,900
    Property Details:
    Detached
    3 bedroom, 3 bathroom, 5 parking

2. Sudbury

  • Average Home Price: $356,633
    Annual Price Growth: +38%
    What you could buy: 4436 Hector
    List Price: $349,700
    Property Details:
    Detached
    5 bedroom, 2 bathroom, 1 parking


3. Windsor-Essex

  • Average Home Price: $492,480
    Annual Price Growth: 31%
    What you could buy: 686 Dynasty
    List Price: $488,888
    Property Details:
    Detached
    3+1 bedroom, 2 bathroom, 1 parking

4. Halifax-Dartmouth

  • Average Home Price: $433,000
    Annual Price Growth: +31%
    What you could buy: 3145 Veith Street
    List Price: $424,900
    Property Details:
    Semi-detached
    4 bedroom, 3 bathroom, 0 parking


5. Ottawa

  • Average Home Price: $591,413
    Annual Price Growth: +26%
    What you could buy: 83 Armagh Way
    List Price: $598,800
    Property Details:
    Detached
    4 bedroom, 3 bathroom, 3 parking

6. Trois Rivières, CMA

  • Average Home Price: $225,694
    Annual Price Growth: +24%
    What you could buy:450-452 Rue Lacerte
    List Price: $219,900
    Property Details:
    Duplex
    2 bedroom, 1 bathroom, 0 parking

7. Gatineau CMA

  • Average Home Price: $338,679
    Annual Price Growth: +21%
    What you could buy: 26 Rue Beauséjour
    List Price: $325,000
    Property Details:
    Single Family House
    5 bedroom, 2 bathroom, 0 parking

8. Montreal

  • Average Home Price: $516,350
    Annual Price Growth: +20%
    What you could buy: 85 Rue De Castelnau O. #413
    List Price: $519,000
    Property Details:
    Condo Apartment
    2 bedroom, 1 bathroom, 0 parking

9. Sherbrooke CMA

  • Average Home Price: $317,545
    Annual Price Growth: +19%
    What you could buy: 1786 Rue des Pois-de-Senteur
    List Price:$320,000
    Property Details:
    Single-Family House
    3 bedroom, 2 bathroom, 0 parking

10. Thunder Bay

  • Average Home Price: $258,738
    Annual Price Growth: +16%
    What you could buy: 1405 Arthur St. West
    List Price: $269,900
    Property Details:
    Detached
    2 bedroom, 1 bathroom, 0 parking


11. Calgary

  • Average Home Price: $518,237
    Annual Price Growth: +15%
    What you could buy: 201 560 6 Ave
    List Price: $525,000
    Property Details:
    Apartment
    2 bedroom, 2 bathroom, 1 parking

12. Quebec CMA

  • Average Home Price: $313,811
    Annual Price Growth: +14%
    What you could buy: 1571 Rue Camus
    List Price: $309,000
    Property Details:
    Single-Family House
    3 bedroom, 2 bathroom, 0 parking

13. Winnipeg

  • Average Home Price: $320,814
    Annual Price Growth: +10%
    What you could buy: 250 Queen Street
    LIst Price: $309,900
    Property Details:
    Single-Family House
    3 bedroom, 2 bathroom, 0 parking

14. Saguenay CMA

  • Average Home Price: $206,242
    Annual Price Growth: +10%
    What you could buy: 4685 Ch St. Paul
    LIst Price: $209,000
    Property Details:
    Single-Family House
    3 bedroom, 2 bathroom, 0 parking

15. Saint John

  • Average Home Price: $199,853
    Annual Price Growth: +8%
    What you could buy: 251 City Line
    List Price: $195,000
    Property Details:
    Single-Family House
    3 bedroom, 2 bathroom, 0 parking

16. Saskatoon

  • Average Home Price: $331,555
    Annual Price Growth: +7%
    What you could buy: 213 X Ave N
    List Price: $329,900
    Property Details:
    Single-Family Home – Bungalow
    4 bedroom, 2 bathroom, 0 parking

17. Edmonton

  • Average Home Price: $375,874
    Annual Price Growth: +5%
    What you could buy: 605 – 9741 110 St Nw
    List Price: $365,000
    Property Details:
    Apartment
    2 bedroom, 2 bathroom, 0 parking

18. Regina

  • Average Home Price: $273,885
    Annual Price Growth: -3%
    What you could buy: 853 Connaught Street
    List Price: $279,900
    Property Details:
    Row/Townhouse
    3 bedroom, 2 bathroom, 0 parking

The COVID-19 pandemic is having an impact on the housing market with pent-up demand pushing Canadian home prices higher. Bindu Suri has details on Royal LePage’s new market survey forecast.
The suburbs surrounding Toronto, Montreal and Vancouver’s are fueling an uptick in homes beginning construction and properties ready for occupancy, says Canada Mortgage and Housing Corp.

In two reports released Monday, the federal housing agency said that the number of homes in Toronto, Montreal and Vancouver ready for tenants owners has begun soaring the farther one is from those city’s centres, while the number of urban properties starting construction is also edging up.

The availability of lots to build on and affordable prices are pushing up housing completions in a roughly 30-kilometre radius outside these city centres, according to CMHC.

The number of housing completions has peaked in areas between 20 and 30 kilometres from Toronto and Vancouver’s city centres, while Montreal’s peak is even further, at above 30 km, the agency said.

“Montreal has seen the strongest pattern for suburbanization, with the level of housing supply increasing with distance from the city centre and decreasing with population density,” said CMHC’s report.

Read more:
Scores of Canadians have ditched the city. Will the office claim them back?

“Like Montreal, Toronto has experienced urban sprawl with a high level of housing development in remote suburbs. However, Toronto has also seen a boom in housing construction in its active core.”

Urban sprawl is more limited in Vancouver because the area has a relatively stable level of construction in its urban areas, said CMHC.

Its study found that construction activity was the lowest between 5 and 10 kilometres outside the city centres it studied.

Condos were responsible for the bulk of completions close to the city centre, in comparison to single-family, semi-detached, row houses and rental units, which dominated elsewhere.

As one moves further away from the city centre, the condominium supply mainly decreases in Toronto and Montreal, CMHC said.

Read more:
Pandemic housing boom means affordability is no longer just a big-city problem

The trends it found are leading to two challenges.

“First, the increasing trend toward suburbanization may accelerate housing external costs (infrastructure investments, roadway congestion and greenhouse gas emissions),” said the report.

“Second, the relatively low level of housing development in low-income areas in Montreal (and to a lesser degree in Toronto) may indicate affordability challenges in those neighbourhoods.”

The average family income in the Toronto, Vancouver and Montreal areas were respectively $98,635, $89,300 and $78,400, said CMHC.

When income rises in a city, so does the desire to relocate, CMHC found.

Since housing per square foot is cheaper at greater distances, consumers have an incentive to move to less central locations in order to buy a bigger dwelling, it said.

This leads to the richest families living in the suburbs, despite longer travel times.

CMHC’s insights into housing completions came as it announced that the annual pace of housing starts rose 23.1 per cent in January, as single-family homes in Montreal started to reach their highest level since February 2008.

The seasonally adjusted annual rate of housing starts rose to 282,428 units in January.

Urban starts were up 27.7 per cent to 266,877 units, as starts of multi-unit buildings in cities rose 24.1 per cent to 193,328 units, and starts of single-family homes in cities rose 38.1 per cent to 73,549 units.

Rural starts were estimated at a seasonally adjusted annual rate of 15,551 units.

The month’s figure included housing starts from Kelowna, after the region wasn’t surveyed in December due to the COVID-19 pandemic.

The annual pace of housing starts excluding Kelowna was 281,389 units in January, up 22.7 per cent from 229,350 units in December.

The six-month moving average of the monthly seasonally adjusted annual rates of housing starts was 244,963 units in January, up from up from 238,747 units in December.

Canadian households saw net-worth make big gains over the past few decades. Using Statistics Canada (Stat Can) data from the recently released Survey of Financial Security (SFS), we can see how net-worth evolved for each age group from 1999 to 2019. Generally speaking, net-worth soared for most demographics. However, there are some notable exceptions, like people under 35 in Toronto. Those people have seen their median net-worth drop compared to their peers 20 years ago.

Canadians Have Seen The Median Net-Worth Double Over 20 Years
Canadian households have seen a huge increase in median net-worth over the past 20 years. The median net-worth for all households reached $329,900 in 2019, up 115.48% from 1999. The fastest growing age group was those 45 to 54, with a median net-worth of $521,100 – up 91.02% over that period. Those between 35 and 44 experienced the slowest growth, with a median net-worth of $234,400, up 68.03% over the period. Most of Canada saw gains from the rise in wealth, but those under 35 have some notable exceptions.

Toronto Sees Median Net-Worth Decline For People Under 35
Canadians under the age of 35 made big gains in their median net-worth, except in Canada’s biggest city. Across Canada, the median net-worth for this age group jumped to $48,800 in 2019, up 87.69% from 1999. Vancouver’s youth saw the median net-worth rise to $78,900, up 319.3% over the same period – over 3x the national rate. On the flip side of that stat is Toronto, which saw the median net-worth fall to $48,000, down 10.11% over the two decades prior. Yes, fall. Toronto is one of two cities in the data set to show a decline over the past two decades, with Calgary being the other.

Canadian Median Net-Worth Change Under 35
The percent change in estimated median net-worth of Canadian households led by someone aged 35 and under from 1999 to 2019, for selected regions. Adjusted for inflation.

Canadians Between 45 And 54 See Biggest Median Net-Worth Gains
Canadian households led by people between 45 and 54 saw the fastest growth at the national level. As stated above, this age group now has a median net-worth of $521,100 in 2019, up 91.02% since 1999. Toronto’s median net-worth for this age group reached $840,300, up 207.91% over the same period. Households in Vancouver saw more modest gains at $757,000, up 82.06% over the two decades. Toronto is greatly overrepresented in terms of growth for this demographic. Vancouver is underrepresented in this area.

Canadian Median Net-Worth Change By Age
The percent change in estimated median net-worth of Canadian households by age of household head from 1999 to 2019, for selected regions. Adjusted for inflation.

One important factor to consider for these demographics is their age in 1999. Most middle class net-worth has been produced by a rise in real estate values, not investments. This helps provide some context for the fastest growing demographic. Those between 45 and 54 would have been 24 and 35 at the first measurement. In a city like Toronto, they would have been buying real estate at the inflation adjusted trough.

Buying at this time would have accelerated their net-worth, with ideal market timing. It would have been near perfect generational timing in a city like Toronto. By 2019, the average home buyer across Canada is now 36. This means on average they would have lacked any real estate gains.


TREB) is unveiling its must-read Market Year in Review & Outlook 2021 Report and eagerly awaited digital digest containing TRREB’s annual market outlook, up-to-date Ipsos consumer polling results, the most recent Altus new home and commercial statistics, rental market trends, research on innovative approaches to bring on more housing supply and mortgage market trends. “The pandemic certainly resulted in an unprecedented year for real estate in 2020, but it hasn’t put a damper on the overall demand,” said Jason Mercer, TRREB Chief Market Analyst. “Looking ahead, a strengthening economy and renewed GTA population growth following widespread vaccinations will support the continued demand for both ownership and rental housing. But over the long run, the supply of listings will remain an issue, particularly in low-rise segments.”

2021 Market Outlook

Combined home sales reported through TRREB’s MLS® System for the GTA, South Simcoe County and Orangeville are expected to reach 105,000. • Strong sales growth will be supported by continued economic recovery, including jobs and record or near-record lows for borrowing costs. • The pace of new condominium apartment listings will start to ebb, especially in the second half of the year. With low-rise listings remaining constrained, expect total new listings to come in at the 160,000 marks. • Market conditions for low-rise homes, including detached houses, will remain very tight, with sales rising at a faster pace than listings. • The overall average selling price for all home types and areas combined will eclipse the $1,000,000 mark for the first time, reaching $1,025,000 and representing a year-over-year increase of 10 % • While mortgage deferrals were initially a concern early on in the pandemic, Mortgage Professionals Canada does not anticipate any pronounced uptick in mortgage delinquencies that would create systemic concerns as we move through 2021. Most property owners who took advantage of mortgage deferrals did so out of an abundance of caution rather than financial necessity and therefore have resumed their regular payments.


Back in 2015, Toronto’s biggest issue was traffic congestion. Or, at least, that was how it seemed at City Hall, when city council approved a $919-million project to reconstruct one section of the Gardiner Expressway.

Much has changed since then. Toronto is bigger, richer and more unequal. Housing affordability is the biggest issue in local politics. And, of course, the COVID-19 pandemic has tested the city’s social fabric and its fiscal health.

Now Toronto can address all those issues with one move: combining the eastern end of the Gardiner Expressway with Lake Shore Boulevard. This would open up more than five acres of land for a new neighbourhood, which could generate $500-million in land sales and development charges. It’s enough to build hundreds of units of affordable housing.

The city’s 2021 budget process is under way right now, and the contracts for the last leg of the Gardiner Expressway reconstruction at the intersection of the Don Valley Parkway will likely be awarded this year. This is the moment to change lanes.

Why? Because bringing this piece of the expressway down to the ground, merging it with the Lake Shore Boulevard underneath for just 800 metres, would have huge financial implications.

The city almost took that route back in 2015. City staff implied it would be better to pursue this “boulevard” option, which was significantly cheaper to construct and maintain. The difference was estimated at $458-million over the life of the roadway. Yet in a 24-21 vote, council chose to rebuild this piece of the Gardiner in a so-called “hybrid” option.

Impact of Gardiner Expressway realignment alternatives

Between 2015 and 2018, the city of Toronto approved a plan to rebuild a portion of the Gardiner Expressway. The approved scheme would develop approximately 7.5 acres of land in the area. The previously considered boulevard scheme, to merge this section of the expressway with Lakeshore boulevard, creates 12.9 acres in total; shifting to that plan now could generate an extra $500-million in city revenues.


It was a murky debate. Opponents of the boulevard overstated its effects on traffic. Highway drivers would briefly share an eight-lane road, punctuated by three stoplights, before merging back onto an expressway. City studies estimated three-minute delays in rush hour, affecting a small number of people. Only about 3 per cent of commuters into downtown Toronto use the Gardiner East. Effects on freight were also exaggerated, and these could be solved with a truck-only lane during rush hour.

On the other hand: There’s a downtown neighbourhood at stake. The Gardiner East zone will soon be prime land, surrounded by parks and the renaturalized Don River.

The hybrid plan was altered and approved in 2018. Part of it is now under construction. And some land that could have been developed is now off the table. But east of Cherry Street there is still some possibility for change. The current version, a city spokesperson confirmed this week, opens up 7.5 acres near the Don River, versus 12.9 acres in the boulevard option.

That extra acreage is now worth roughly $450-million, according to Jeremiah Shamess, a vice-president at Colliers Canada who specializes in development land. He analyzed its value this week at my request. He estimates the whole 12.9 acres, in 11 blocks, could be worth $1.229-billion over the next dozen years, if sold gradually.

The larger figure is five times as much as the city estimated in 2015, thanks to a combination of land values – which have doubled – and higher densities.

There’s more. If developed privately, this new neighbourhood would generate development charges and fees: at least $75-million for the additional 5.4 acres alone. Plus, of course, property tax revenues in the tens of millions annually.

Mr. Shamess’s analysis is based on a new design by architecture firm Smart Density. It imagines 6.5 million square feet of buildings in this area, with 8,000 homes housing 15,000 people and a mix of other uses. “We looked at the potential of the area from the perspective of creating great urban design while working within Toronto’s planning policies,” said Naama Blonder, an architect and partner at Smart Density.

Their scheme lines the waterfront with a public promenade and mid-rise buildings. There’s a generous public park and a 115,000-square-foot public building that would house a school, library and community centre. The new Lake Shore Boulevard would be lined with broad sidewalks.

Even with all that, there is room to add 15 towers ranging from 32 to 53 storeys. That’s comparable to private development in the area.

This proposal is speculative, and there are question marks. The highway design would need to be re-examined. And the city might choose not to build so much.

But it should. Toronto’s official plan now calls for more than 200,000 people to move into the downtown core by 2041. The Gardiner East is about three kilometres from King and Bay. It’s next door to a new office district, East Harbour, proposed with 50,000 jobs. It is close to the Quayside site that Sidewalk Labs wanted to develop. A new LRT is planned for the area; so is the proposed Ontario Line subway.

Just to the southeast, a $1.2-billion project to remake the Don River is well under way. A new set of excellent parks spanning 200 acres – half as large as High Park – will begin opening in 2024.

So this is a fine place to plan a postpandemic urban neighbourhood. Green but dense. Served by transit and light on cars. Home to 15,000 and, if the city chooses, thousands of them in permanently affordable housing. These are the things you can build in a rich and growing city, the sort of things on which leaders hang their legacy.

Or we could put that expressway back up, and spin our wheels.

Ever since the housing market rally began in 2020’s second half, the number of Toronto region communities recording 20 percent-plus annual price gains in their detached home markets has been climbing each month.

Of the 30 suburban cities and towns tracked by the Toronto Regional Real Estate Board (TRREB), 20 experienced detached home price increases of over 20 percent in December. That number shot up again to 30 cities and towns in January, meaning every single suburban community in the Toronto region — from large cities like Brampton to small towns like Caledon — recorded at least a 20 percent increase in detached home prices last month.

It’s another sign that buyers’ huge appetite for detached homes has yet to be satisfied. The supply that’s available on the market continues to be outmatched by demand and this misalignment is driving prices up significantly across the entire region.

The average home pricing data for January was released earlier this week by TRREB.

Aurora and King posted the highest detached home price increases in the region last month, with the former rising nearly 58 percent to an average price of $1,718,745, while the latter posted a 54.4 percent gain to $2,290,966. Detached homes in King were, on average, the most expensive in the Toronto region in January, even outperforming the City of Toronto’s central region which is tracked separately by TRREB.

Adjala-Tosorontio in Simcoe County and Pickering and Ajax in Durham Region rounded out the top five, each posting detached home price gains in the low 40 percent range.

Only nine of the suburban cities and towns tracked in TRREB’s January report had average sale prices below $1 million for their detached home markets. That’s down from 18 in January 2020.

“The GTA real estate market surpassed even the most optimistic forecasts in 2020 — a trend that accelerated in January 2021,” wrote Diana Petramala and Daniel Bailey, researchers with Ryerson University’s Centre for Urban Research.

“Mortgage interest rates hit rock bottom in January, which likely explains the eye-popping performance across the GTA,” they added.

The appetite for homeownership in Canada has been strong to start the year thanks in large part to low interest rates, according to nesto, an online mortgage brokerage.

A report from the firm showed that 60% of the brokerage’s users intended to purchase a new home last month, increasing from 48% in January 2020, but it’s come at the expense of refinances, which had declined by 5% since November.

“Just like every year, the first week of January was full of refinance applications resulting from many Canadians reviewing their household budgets,” said nesto’s report. “We expected refinance volumes to increase throughout the month, but to our surprise it was overshadowed by new purchase requests.

“As for overall demand, we recognized a large volume increase through Q4 that is snowballing into Q1. The demand has resulted in nesto adjusting staffing priorities in order to facilitate what we predict to be another very active and busy year in the real estate and mortgage space.”

Mortgage rates are steadily declining below what they were in 2020, which nesto, noting that its best insurable variable rate declined by 1.6% to 1.3%, attributed to robust home purchase demand. In Canada’s two most populous provinces, Ontario and Quebec, 65-70% of nesto’s application requests for new properties are from homebuyers who have just begun their searches, rather than from buyers who have already found their desired properties.

Moreover, the median amount for projected property value declined from $449,000 in October to $440,000 a month later, and down payments decreased from $62,000 to $50,000. The median down payment declined to around 10% last month from 13% in January 2020.

In Ontario, the median purchase price dropped by $50,000 to $540,000 in January from two months prior, while the median down payment fell by $30,000, and the down payment percentage hovered around 20%. In Quebec, the down payment percentage remained at 10%.

The report also says that Canadian parents are playing pivotal roles helping their adult children enter the housing market.

“A trend we recognize through our user engagement that is more prominent in Ontario vs. Quebec, is that many young home buyers in Ontario are starting off with a substantial gift from the bank of mom and dad,” said the report.


Homebuyers were out in full force again in January, snapping up 6,928 homes across the Toronto region. And, according to a new forecast, this momentum out of the gate is expected to persist throughout the entire year.

The Toronto Regional Real Estate Board (TRREB) released its 2021 Market Outlook this week, predicting that low interest rates, incremental economic improvements and widespread vaccine distribution will keep the housing market hot.

If the Toronto region meets or surpasses TRREB’s home sales forecast of 105,000 transactions for 2021, it will be the second-highest sales total ever recorded for a single year, coming in behind only 2016, when 113,133 homes changed hands.

The tremendous run-up in home sales and price growth over 2015 and 2016 eventually led the provincial government to roll out its Fair Housing Plan in an effort to tamp down what it deemed to be runaway activity in the real estate market.

After the policy-induced slowdown in sales and price growth from 2017 to 2019, market commentators believed the Toronto region’s housing market was ready to take off again in 2020. Of course, this prediction ended up being true, but didn’t play out in a way that anyone could have predicted. Home sales fell off a cliff through the first spring lockdown and then skyrocketed to record levels in the second half of the year.

While 2021 is sure to be another unusual year, with the pandemic’s effects still very much impacting the housing market, it has at least become a bit more predictable.

Beyond home sales continuing at a robust pace, the average home price for the Toronto region is expected to surpass $1 million. TRREB says this will mark the first time the selling price for all property types and areas combined will exceed this level on a calendar year basis. The average price is forecast to hit $1,025,000, for an annual increase of 10 percent in 2021.

The board also believes the rate at which new condo listings are hitting the market will decelerate by the second half of the year, while single-family home listings will continue to be low relative to demand.

“The key challenges to the housing market over the next year and beyond will be a familiar one: lack of supply,” wrote TRREB in the report.

“Policymakers at all levels of government have acknowledged the need for a greater supply of housing and a greater diversity of housing types.”

After a busier-than-usual December home buying season, purchasers across the Toronto region spent the first month of 2021 continuing their buying spree.

January home sales were up over 50 percent compared to the same month last year. Robust buyer activity and tight supply in the low-rise market sent the overall average price of a Toronto region home up 15.5 percent over January 2020. The average sale price last month was $967,885, up from $838,087 a year ago.

Many of the other trends that market observers had grown accustomed to seeing in the second half of 2020 were present in the first month of housing market data for the new year, published today by the Toronto Regional Real Estate Board (TRREB).

For one, sales across all low-rise property types — detached, semi-detached and townhomes — saw healthy double-digit sales growth. Detached homes in the suburban 905 area remained the single most sought-after property type. There were 2,244 suburban detached homes sold in January, out of a total of 6,928 transactions recorded across the region.

The City of Toronto’s struggling condo market continued to post price declines last month, with the average selling price falling eight percent annually to $624,886.

But, as was the case in December, condo sales surged again, providing more hope that the high volume of listings currently on the market may be steadily whittled down by bargain-hunting buyers.

Condo sales recorded the sharpest increase of any property type on an annual basis, up across the region by over 85 percent for a total of 2,471 transactions. Condo sales growth also outpaced new listings growth in the City of Toronto in January, with TRREB noting that this could signal “renewed growth in condo prices later this year” if this trend continues.

Here are 8 things you should be working on this year 2021,it’s that important!


1 Decide how you want to feel every morning! It’s up to you.

2 Work on your mind and body daily! Your life is in your hands.

3 Set goals that are specific and change your approach along the year. Be quick and agile with your business.

4 Make the decision that you will work on bettering yourself daily.

5 Be mentally ready to work hard and smart EVERY DAY! Work on your actions that break down your big goals!

6 Organize a list of people you need to talk to that are important for your business. Don’t leave it to chance. The right relationships can change your life and business.

7 Set time to work on your money making activities at least 2 hours a day!

8 Followup is a must. Don’t skip the followup!

GTA Real Estate Market Update by Toronto Real Estate Board

• January 2021 home sales amounted to 6,928 – up by more than 50 per cent compared to January 2020. This strong start to 2021 included sales growth across all major segments including condominium apartments, both in the City of Toronto and surrounding GTA regions.

• New listings were also up on a year-over-year basis in January, but not by the same annual rate as sales. This means market conditions tightened compared to January 2020, resulting in the continuation of double-digit growth in the MLS® Home Price Index and the average selling price.

• The average selling price for January 2021 was up by 15.5 per cent to $967,885 year-over-year. The MLS® HPI Composite Benchmark was up by 11.9 per cent over the same period

• Price growth was driven by the low-rise market segments, while the average condo apartment price was down in Toronto. However, if we continue to see condo sales growth outstrip condo listings growth, we could start to see renewed growth in condo prices later this year.


If you’ve been following the housing market (in most cities) over the last year, this chart likely won’t surprise you. It is from a recent City Observatory article by Joe Cortright talking about the “k-shaped housing market” that we have seen emerge over the last year. The above is for the US, but I would imagine that the chart would look similar for Canada, as well as for other countries. Here’s an excerpt from the article:

There’s an obvious explanation for the different trajectories of house prices and rents: Low income workers rent; high income workers own and buy homes. High income households have been barely grazed by the Covid-19 recession. In fact, the combination of low interest rates and enforced savings (because many kinds of consumption spending, including dining, entertainment, travel and even much retail have been constrained by lockdowns), mean higher income households may find housing a much more attractive spending item. If you can’t go out to dinner, or take a vacation, you have more money to spend on a new home. Low wage workers are in the opposite situation. Low wage workers have borne the brunt of the recession; they are also much more likely to be renters than higher income households.

It is perhaps worth reiterating that our fixation on homeownership is not universal. If you live in Switzerland — a very wealthy country — you’re more likely to rent than own. And if you live in Germany, you’re more likely to live in an apartment than in a low-rise house. Still, that doesn’t change the fact that the impacts of COVID-19, and our lockdowns, have been felt unequally. This chart is an example of that.

The winning proposal of the multi-million dollar renovation to Hamilton’s downtown entertainment facilities proposes massive changes to FirstOntario Centre, FirstOntario Concert Hall and the Hamilton Convention Centre, as well as a series of high-rises.

The bidder, Hamilton Urban Precinct Entertainment Group (HUPEG) — which includes Carmen’s Group, LiUNA, dpai architects, Fengate Capital, Meridian Credit Union, Paletta International and Jetport Inc. — offered a $500-million pitch.

Mayor Fred Eisenberger made the highly anticipated announcement during Friday’s city council meeting, saying that the group had come out “on top.”

“I think it’s going to be a great opportunity for transformational upgrades to our facilities” he said, calling the investment “historic.”

More details will come when the master agreement is finalized, which the city says will be in late 2020. The media release says this means arena renovations would start in fall 2021.

PJ Mercanti, the group’s president and Carmen’s Group CEO, said that should this process be successful, they look forward to delivering Hamilton’s “next generation of entertainment and cultural assets.”

“We are delighted that council and staff have put their confidence in our group and we certainly look forward to making Hamilton proud,” he said. “We recognize that this is a tremendous opportunity to redevelop the city’s prime cultural and entertainment assets. And so we are eager to get to work.”

Here are some of the plans suggested so far.

Planned FirstOntario Centre renovations include a new building exterior, a “transformation” of the lower bowl, expanded concourse level, and new curtaining system for the upper bowl balcony. The group proposes a microbrewery, suites and hospitality clubs.

They’re also looking at developing the York Boulevard side to make the building accessible at street level so that people can experience services — like food or retail — outside of when the centre is hosting an event.

HUPEG originally suggested keeping FirstOntario’s seating capacity, and relocating the convention centre to a part of Hamilton City Centre.

Three high-rises downtown would include the Art Gallery of Hamilton, the convention centre, condos and commercial space. Two more towers are possible at the corner of Bay Street and King Street East.

The media release said more than $16 million in upgrades are planned to the convention centre, concert hall, and art gallery.

Around $340.5 million in “auxiliary mixed-use development, including affordable housing” will be a part of any residential developments that come out of this.

Arena renovations ‘a long time coming’
The group will take on all capital costs to renew the facilities, as well as operation and maintenance of FirstOntario Centre and FirstOntario Concert Hall for 99 years. They would also take over the convention centre “indefinitely” without any monetary contribution from the city.

The city said this would create $155 million in savings over the next 30 years.

Coun. Sam Merulla (Ward 4), who pushed for the city to leave the entertainment businesses, said the downtown “renaissance” made it a good time to get out. He also re-iterated that it would result in “hundreds of millions of dollars of savings.”

“This is one issue that I’m very, very proud of,” Merulla said. “It wasn’t easy, I had a lot of resistance. But I guess anything worth fighting for is worth going through those type of initiatives.”

Jasper Kujavsky, who is with the winning proposal, says he always believed the arena could be revitalized prior to Merulla’s motion in 2017 that prompted staff to investigate opportunities for private sector-led redevelopment.

Kujavsky recalled walking into the then-Copps Coliseum 30 years ago for the first time. The changes, he said, have been a “long time coming.”

“I’m interested in every aspect of this project, but I have a special place in my heart for the arena renovations. And it’s the one that I perhaps have the most direct oversight of and it’s the one that’s the most immediate priority from the city’s perspective,” he said.

The other option considered was a $200-million plan by Vrancor Group, a prolific Hamilton development company owned by Darko Vranich. Among its changes, the project proposed limiting the arena’s capacity to around 15,400 seats, with the possibility to expand to 17,000 if needed.

“The numbers showed that the precinct group was the better proposal, better bid and that’s the direction we’re moving forward on,” Eisenberger said, and added that he think the announcement will get a positive reaction from Hamilton Bulldogs owner, Michael Andlauer.

Source:CBC

The Oshawa Census Metropolitan Area (CMA) is leading the country in population growth.

That’s according to a new ranking from Statistics Canada, which reports the Oshawa CMA had a population growth rate of 2.1 per cent in 2020.

According to the agency, the Oshawa CMA beat out Halifax and Kitchener-Waterloo-Cambridge for the top spot. Both of those cities reported a growth rate of two per cent in the last year.

The only other Ontario CMAs to make the top ten were Barrie, at 1.8 per cent, and Belleville, at 1.6 per cent.

A CMA is an area consisting of one or more neighbouring municipalities with a combined 100,000 people or more, situated around a core of at least 50,000 people.

The Oshawa CMA also includes Whitby and Clarington.

Overall, Canada’s population growth rate is 1.1 per cent, according to the agency.

Although the COVID-19 pandemic did not impact the GTA housing market quite as profoundly as some thought it might, the province’s lockdown measures made cities a little less desirable than rural and suburban areas with larger homes and yards, and condo-heavy municipalities such as Toronto suffered a bit more as a result.

In Mississauga, a city comprised of both sprawling subdivisions and modern condo towers, the condo market saw significantly fewer sales than the more in-demand low-rise market.

condo apartment sales declined the most sharply in Peel Region (Mississauga, Brampton and Caledon). Sales across the region fell 20 per cent year-over-year between April and December 2020.

The report says that condo sales declined 22 per cent in Brampton and 20 per cent in Mississauga.

That said, condo units are still pricy.

the average price for condo apartments grew 9 per cent to $515,801 in Peel, something the report says could be driven by buyers seeking larger units with more square footage due to pandemic-driven lifestyle shifts. Prices rose 13 per cent in Brampton and 8 per cent in Mississauga.

But how did home sales fare overall in Mississauga and other GTA cities? looked at home sales and the average sold price data from the Toronto Regional Real Estate Board (TRREB) for the period between April 2020 and December 2020 to examine how cities were impacted by people opting to abandon urban areas for municipalities with larger homes and more outdoor space.

In Mississauga, low-rise sales climbed 6 per cent and the average sold price hit $1,151,549.

Not unexpectedly, the report found that there was a higher rate of sales and price growth for low-rise homes versus condo apartments in nearly every region. For the GTA as a whole, this translated to an 11 per cent increase in detached and semi-detached house sales and a 10 per cent decrease in condo apartment sales compared to 2019.

The average house price in the GTA rose 13 per cent (or $132,736 to $1,123,618 year-over-year) during this period, and the average condo apartment price rose just 4 per cent (or $26,056, to $621,637).


The report says that “urban flight” did indeed become a factor last year, with municipalities furthest from Toronto seeing the largest jumps in the growth rate of house sales.

According to the report, Simcoe County had the highest increase in house sales among GTA regions, as detached and semi-detached house sales grew 21 per cent year-over-year and 2,393 houses changed hands. The average sold price grew 17 per cent annually to $766,083.

Following Simcoe County was Durham Region, where there were 1,143 more detached and semi-detached house sales between April and December 2020—a 17 per cent increase. The

Other municipalities that saw a big uptick in sales include King (75 per cent increase in house sales and a 20 per cent annual increase in the average home price to $1,798,590), Georgina (36 per cent spike in sales and 24 per cent increase in the average house price to $710,758), and Caledon (29 per cent uptick in sales and 21 per cent climb in price to $1,224,675).

Interestingly enough, condo apartment sales grew in some parts of the GTA. Simcoe County saw a 108 per cent increase in condo apartment sales and a 14 per cent increase in the average sold price for condo apartments. That said, the report found that the total volume of condo apartment sales in the region was relatively low, with just 106 condos being sold.

Municipalities with the highest per cent increase in detached and semi-detached house sales, April to Dec 2020, compared to April to Dec 2019

1. King (York Region)

April to Dec 2020 sales: 379 (+75%)
April to Dec 2020 average price: $1,798,590 (+75%)

2. Innisfil (Simcoe County)

April to Dec 2020 sales: 829 (+36%)
April to Dec 2020 average price: $703,386 (+16%)

3. Georgina (York Region)

April to Dec 2020 sales: 824 (+36%)
April to Dec 2020 average price: $710,758 (+24%)

Municipalities with the smallest increase in detached and semi-detached house sales, April to Dec 2020 compared to April to Dec 2019

1. Orangeville (Dufferin County)

April to Dec 2020 sales: 365 (-6%)
April to Dec 2020 average price: $691,983 (+15%)

2. Adjala-Tosorontio (Simcoe County)

April to Dec 2020 sales: 124 (-4%)
April to Dec 2020 average price: $899,252 (+32%)

3. Toronto (West)

April to Dec 2020 sales: 3,340 (-3%)
April to Dec 2020 average price: $1,226,987 (+12%)

Municipalities with the biggest decrease in condo apartment sales, April to Dec 2020, compared to April to Dec 2019

1. Orangeville (Dufferin County)

April to Dec 2020 sales: 17 (-35%)
April to Dec 2020 average price: $394,618 (+17%)

2. Halton Hills (Halton Region)

April to Dec 2020 sales: 15 (-35%)
April to Dec 2020 average price: $459,320 (0%)

3. Newmarket (York Region)

April to Dec 2020 sales: 40 (-23%)
April to Dec 2020 average price: $488,725 (+10%)

Municipalities with the biggest increase in condo apartment sales, April to Dec 2020, compared to April to Dec 2019

1. Innisfil (Simcoe County)

April to Dec 2020 sales: 73 (+265%)
April to Dec 2020 average price: $443,990 (+17%)

2. Whitchurch-Stoufville (York Region)

April to Dec 2020 sales: 31 (+107%)
April to Dec 2020 average price: $636,584 (+30%)

3. Aurora (York Region)

April to Dec 2020 sales: 64 (+56%)
April to Dec 2020 average price: $552,480 (+12%)