Fourth in (what I hope) will be a series on population growth, migration, and what’s going on with Ontario’s housing market.
TL;DR: Although housing completions did not keep up with population growth from 2015–19, they did increase. However, despite the GTA being the prime destination for international talent, the housing completion growth largely happened outside of Toronto CMA.
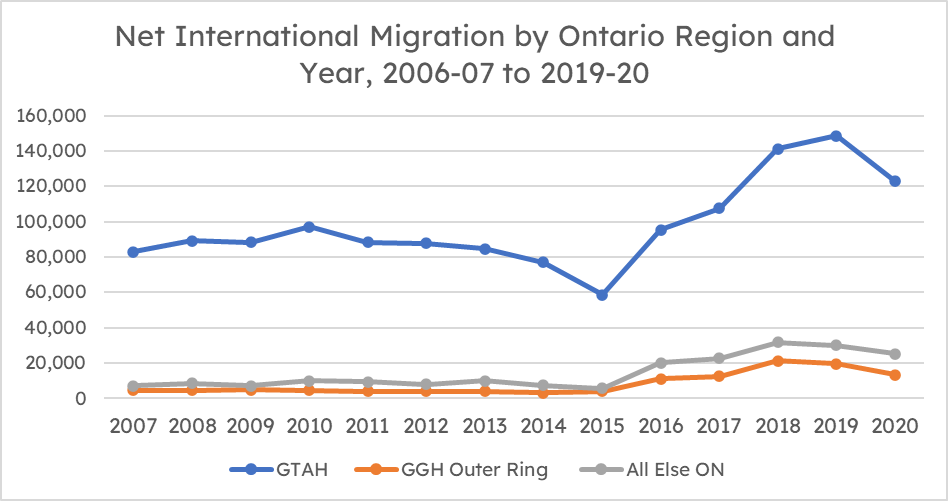
Earlier this week, Smart Prosperity published a report authored by Mohsina Atiq and me called Forecast for Failure: How a broken forecasting system is at the root of the GTAH’s housing shortage and how it can be fixed. Among other things, it examines how Ontario experienced rapid population growth from international sources after 2015, and how Ontario’s Growth Plan that governs the Greater Golden Horseshoe (GGH) failed to both forecast and accommodate this growth:
There have been a number of thoughtful comments and questions around the release of the paper, one of which is, “how did housing completions across Ontario respond to this increase in population?”
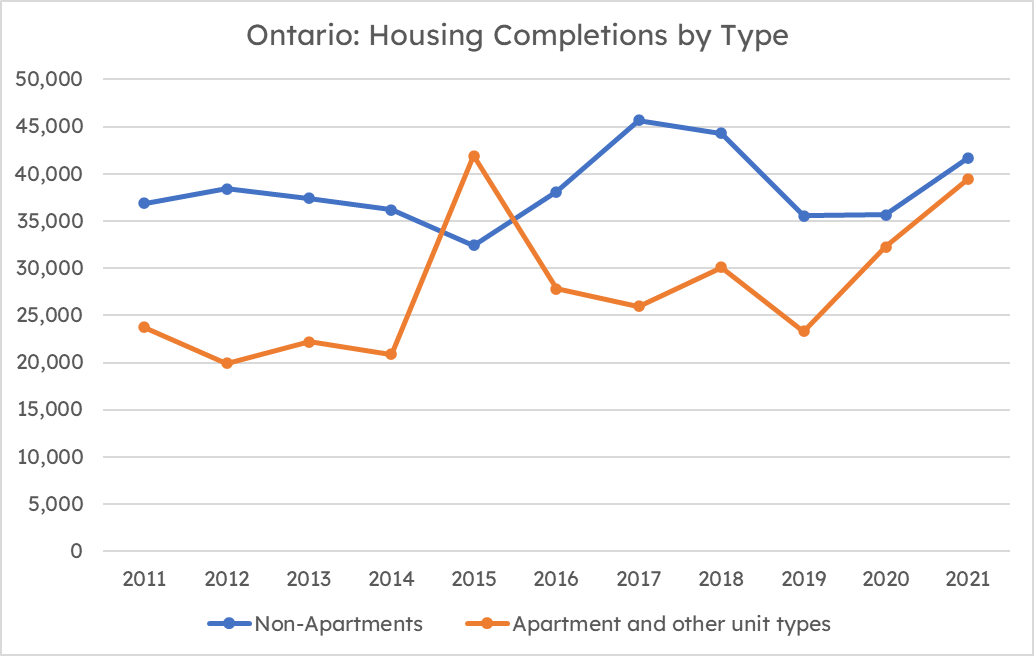
If we look across Ontario, housing completions did go up somewhat after 2015. I’ve broken the data down into apartments (which includes both ownership, including condos, and rentals) and everything else.
But where were these units built? That’s a tougher question to answer than it should be, because our data is terrible. Well, that’s not entirely true — the data is out there, but the user interface to access the data is atrocious. Completions data, at the Census Subdivision (CSD) level, is available from CMHC but it’s impossible to access a time series, for every CSD. So that limits my analysis.
If anyone can figure out how to scrape the CMHC website to get housing completions data, for every CSD in Canada, I’ll be eternally grateful. I’ll even pay money!
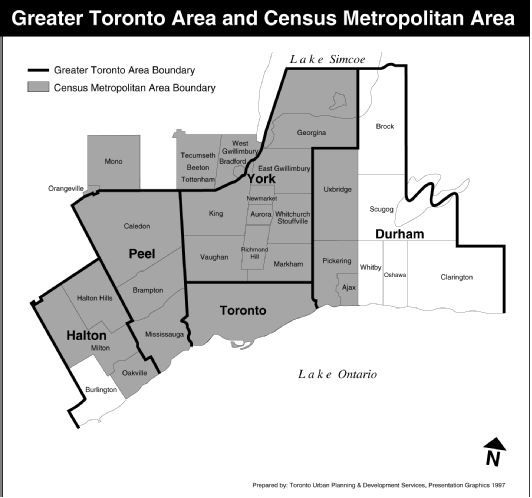
Because of this limitation, I decided to get data for the City of Toronto, Toronto CMA, and Ontario as a whole. The boundaries of Toronto CMA are shown here in grey:
First, let’s start with apartment units. I’ve divided the data into the City of Toronto, Toronto CMA excluding the City of Toronto, and the rest of Ontario.
We’ve seen an increase in the number of units, in all parts of Ontario, in the last couple of years.
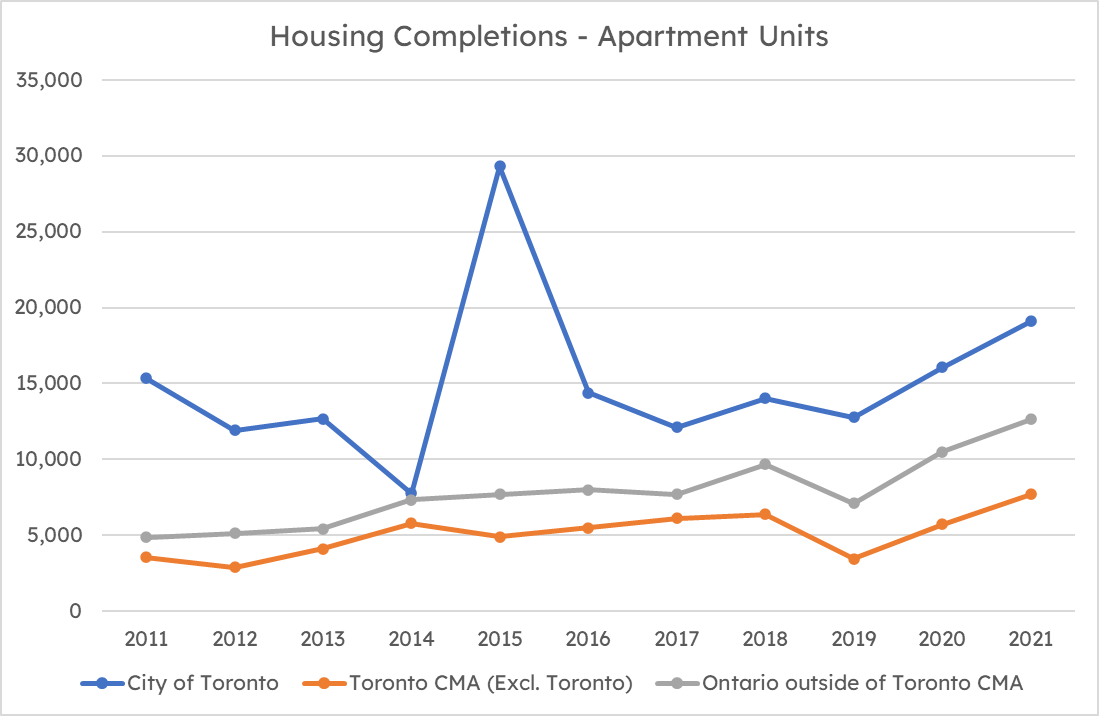
That City of Toronto spike in 2015 is wild. I’d love to learn more about it.
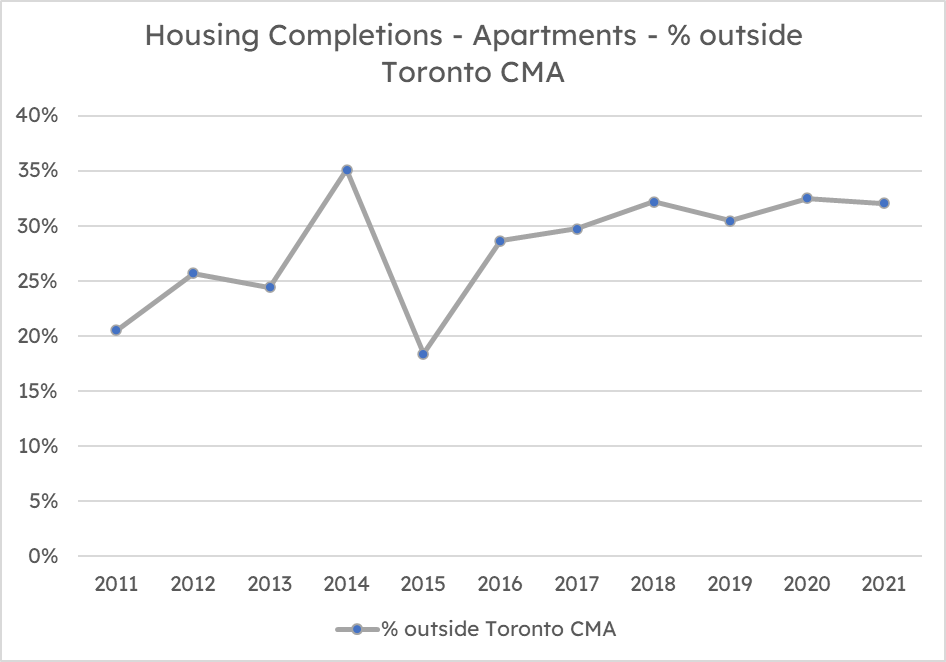
For the last few years, the proportion of apartment units built outside of Toronto CMA has been fairly steady at 30% or so.
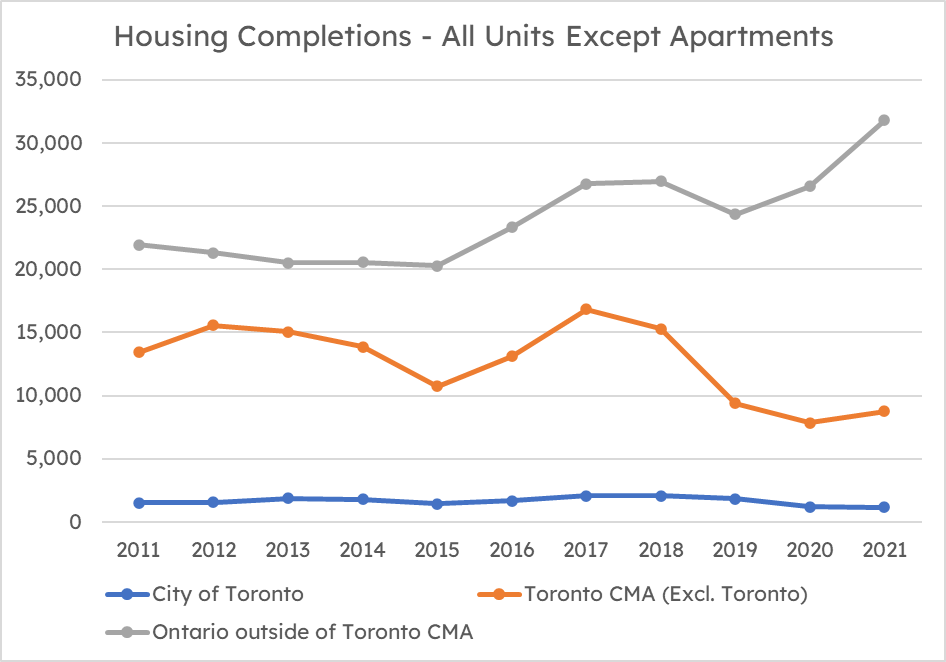
Next, let’s consider all forms of housing excluding apartments. These include single-detached, semi-detached, and row housing. Very few of these units are built in the City of Toronto itself, primarily due to land constraints. In the rest of Toronto CMA, there were elevated completions in 2017, and 2018 was right around 2011–14 levels. Since then, housing completions have been under the level seen at the beginning of the decade.
Contrast this to the rest of Ontario, where housing completions, last year, are now 50% higher than they were at the beginning of the 2010s.
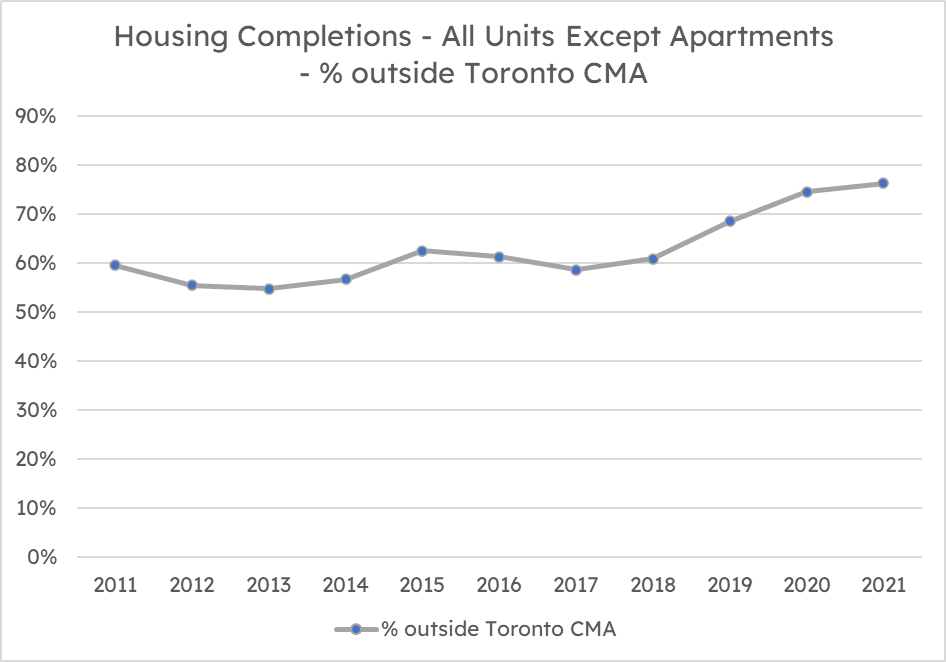
As such, the proportion of non-apartment housing units built outside Toronto CMA has risen from 55% a decade ago to over 75% last year.
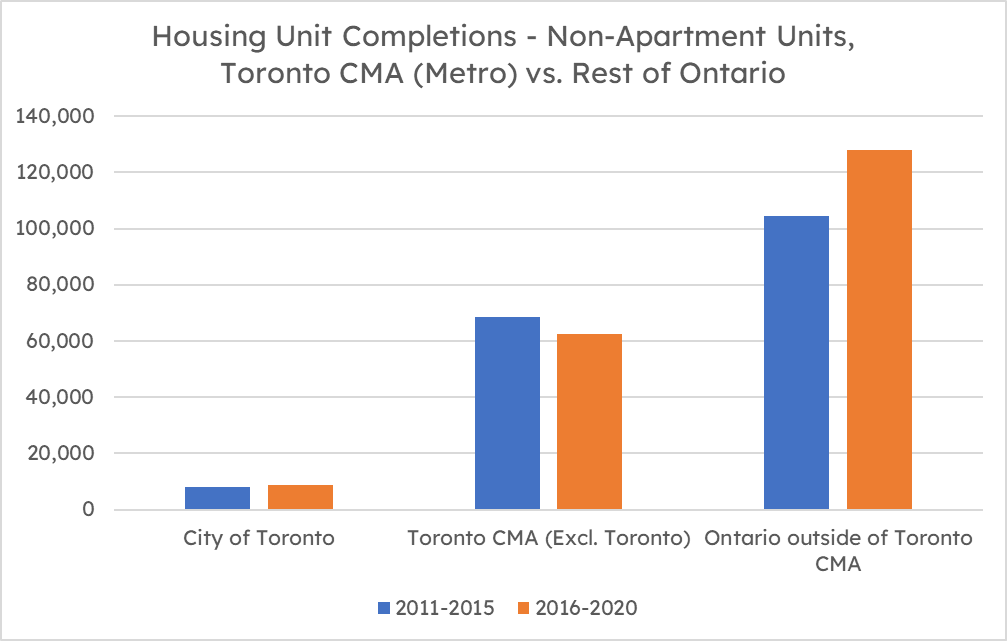
Here is another way to look at the data. We’ll compare two five-year periods: 2011–15 to 2016–20 (so we’ll exclude 2021). Completions of non-apartment units went down in Toronto CMA, but up a fair margin in the rest of Ontario.
It’s really not hard to figure out why we’ve had so many young families drive until they qualify to the rest of the province.


 Maziar Moini, Broker of Record - Home Leader Realty Inc.
300 Richmond St. W., #300, Toronto, ON M5V-1X2
Maziar Moini, Broker of Record - Home Leader Realty Inc.
300 Richmond St. W., #300, Toronto, ON M5V-1X2