
Benjamin Tal — CIBC’s Deputy Chief Economist — is seemingly everywhere. And earlier today, he was delivering an annual economic update at an online event hosted by Brattys LLP (our condo lawyers) in partnership with CIBC. Below are a handful of slides that I found interesting and that I tweeted out during the event.
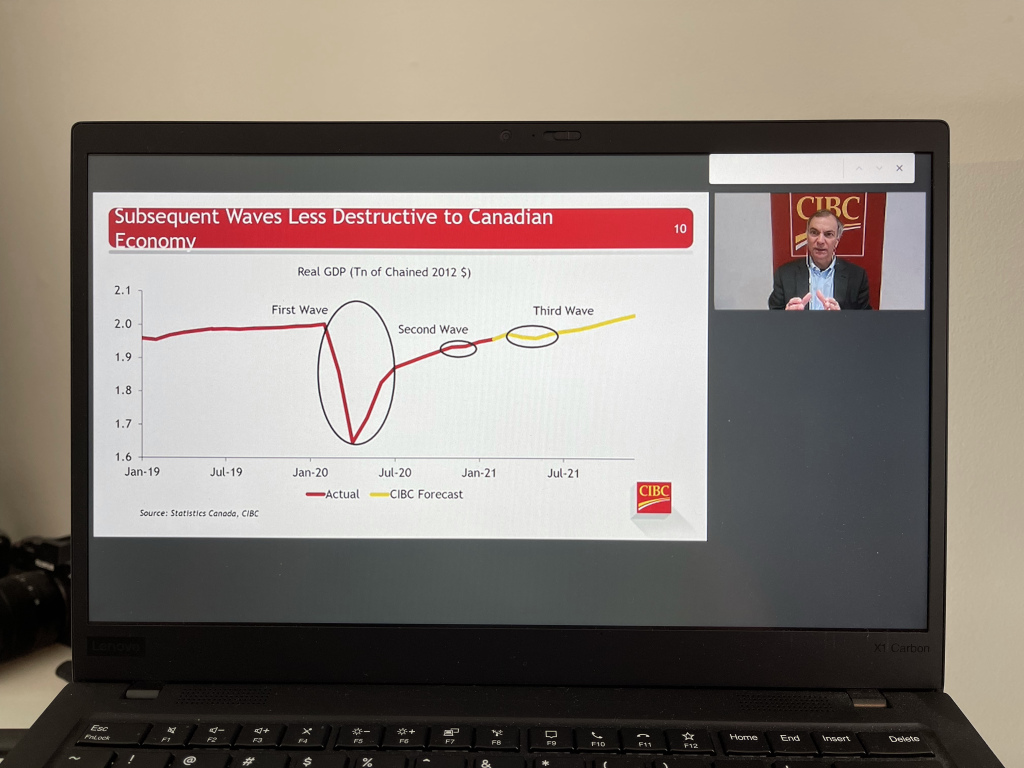
All of our personal risk curves changed during this pandemic. When the first wave hit, we all had no idea how bad this was going to be and what to expect. And so we all stayed home and washed our hands and our groceries. That changed with each subsequent wave. And now we’re all ready and anxious to be done with this.

Tal referred to this as one of the most unequal recessions we’ve ever seen. If you had a high paying job, you probably kept it. And after you stopped spending money on eating out, entertainment, travel, and watching the Leafs lose in person, you likely had a meaningfully higher savings rate. That has created some $100 billion of “excess cash” sitting on the sidelines.
This cash wants to be spent and I think we’re going to see it flying out the door in the second half of this year. Much of it will also flow into services, which should help to prop up the hardest hit segments of the economy. So while there has been some real pain, many are expecting the economy to snap back pretty quickly. Get ready for some euphoria in the second half of this year.
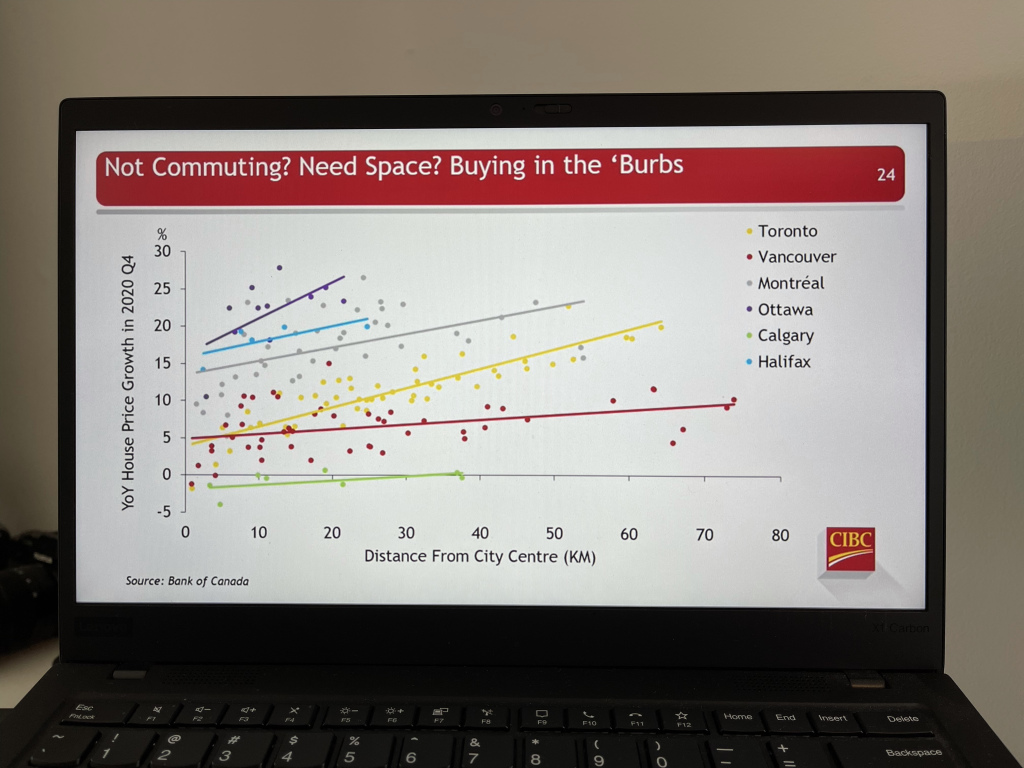
This last slide is particularly relevant to the kind of things we often talk about on this blog. It is essentially showing the increased demand for housing outside of the city during this pandemic (as of Q4 2020).
A flatter line (Vancouver, Calgary) indicates that year-over-year price growth was less affected by “distance from the city center.” On the other hand, a steeper line (Toronto, Ottawa) indicates that price growth was stronger the more you moved outward from the core. In the case of Toronto, it was nearly 20% YoY when you got about 60-70 kilometers out of the city.
But it’s important to keep in mind that the core of Toronto still grew at about 5% year-over-year. About the same as in Vancouver. And in the case of Ottawa, the number looks to be about 17.5% in the city center. These are meaningful numbers and not the kind of symptoms you would expect to see from downtowns in the middle of a death spiral.
I would argue, as I have many times before, that this last chart is the result of short-term phenomena. I bet we’ll see a number of these pitches reverse by the time Q4 2021 arrives.

")


 Maziar Moini, Broker of Record - Home Leader Realty Inc.
300 Richmond St. W., #300, Toronto, ON M5V-1X2
Maziar Moini, Broker of Record - Home Leader Realty Inc.
300 Richmond St. W., #300, Toronto, ON M5V-1X2