Posts

Ontario is raising a tax on home purchases by some foreigners to 20% and making it harder to avoid as it tries to cool a scorching real estate market.

The so-called speculation tax will apply to homes bought anywhere in the Canadian province by foreign nationals and foreign companies, provincial Finance Minister Peter Bethlenfalvy said in a statement Tuesday. Currently, the tax is 15% and applies only to homes in Toronto and surrounding areas.

The soaring cost of homes and rents has become a significant political issue in the province of about 15 million people, and Ontario Premier Doug Ford faces an election in June. In Toronto, the average sale price in February was CA$1.3 million, seasonally adjusted.

Since the pandemic started, even small cities and towns, far from Ontario’s major cities, have seen huge increases in home values as buyers took advantage of ultra-low mortgage rates.

The benchmark price of homes in the London and St. Thomas region, about a two-hour drive from Toronto, was CA$749,000 in February, up 84% in two years. In Barrie, north of the country’s largest city, a typical home is now CA$940,000, according to data from the Canadian Real Estate Association.

Nationally, home prices posted a record monthly surge in February as buyers piled into the market ahead of interest rate increases by the Bank of Canada. Benchmark home prices rose 3.5% last month from January, according to CREA data.

Foreign citizens can apply for a rebate from the Ontario tax if they become permanent residents of Canada within four years of paying it. But rebates will no longer be given to international students or to foreign nationals who are temporarily working in the province. The tax has brought in about CA$600 million in revenue since first implemented in 2017, though some of that may be given back, a government spokesperson said.

“There is no silver bullet to solving the housing crisis,” Housing Minister Steve Clark said in a statement. “Addressing the housing supply crisis is a long-term strategy that requires long-term commitment and coordination with our partners and between all levels of government.” The provincial government said it would work with local governments to implement other measures, including taxes on vacant homes.


Copyright Bloomberg News

The Ontario Government laid out plans this week for two new transit lines that would further connect the GTA and the Greater Golden Horseshoe region.

The province’s 30-year transportation plan, released on Thursday, details several in-the-works and planned future projects, including the construction of the controversial Highway 413. But amongst the list were two new undertakings: an Ontario Line to Toronto Pearson Airport connection and a Burlington to Oshawa line.

The latest infrastructure plan, entitled “Connecting the GGH: A Transportation Plan for the Greater Golden Horseshoe,” comes just 12 weeks before the provincial election. Ford committed to spending $82B over the next decade on several transportation projects, including the two highway projects, expanded passenger rail service, new subway lines, and expansions of several existing highways.

Until now, the Ontario Line, an upcoming 16-km Toronto subway line, was set to run from Exhibition in the west up to the Ontario Science Centre in the east. But the province’s transportation plan calls for the construction of an additional transit loop connecting the Ontario Line to “new major transit hubs where regional services connect, including Pearson International Airport and Richmond Hill Centre, and to other subway and GO Rail lines.”

If it comes to fruition, the Ontario Line loop wouldn’t be the only transit option connecting to the Toronto airport. UP Express trains already offer a route between downtown’s Union Station and Pearson Airport, and the planned Eglinton Crosstown West Extension, expected to be complete by 2031, is set to have a Pearson connection as well.

The Ontario Government’s second transit proposal would be an even larger undertaking, geographically speaking. The provincial plan lays out an initial concept for an east-west “higher order transit connection” between Burlington and Oshawa. It would run north of Toronto, connecting to existing and planned GO Rail, LRTs, and subways along the way.

“It would transform the regional transit system from today’s radial commuter network centred on Union Station to an expansive grid, so people can get where they need to go without going through the downtown core,” the report reads. “This new line will build on already protected lands for the 407 Transitway, a bus rapid transit corridor parallel to Highway 407.”

The provincial government will carry out a planning analysis for the projects to confirm feasibility, as well as analyze project options and network connectivity.

“This is a plan with purpose, built on the guiding principle to ‘get it right’ because we simply can’t afford not to,” Minister of Transportation Caroline Mulroney wrote in the report. “Those choosing to start a family, move for work or build their business in the GGH area are counting on us.”

The projects laid out in the Ontario plan encompass all transit upgrades planned from now until 2051, meaning it may be a number of decades before the two proposed additions become a reality.

From the launch of the first iPhone, to the world’s population reaching seven billion people, a lot has changed in the past 25 years. In that same quarter-century timespan, the Greater Toronto Area’s housing market has also witnessed remarkable transformation.

In its Quarter Century Market Report released today, RE/MAX Canada says that home sales have doubled while prices have soared over 450 per cent in the GTA since 1996, growth that has been supported by market demand and limited home supply. The report examined home buying activity in the nine Toronto Regional Real Estate Board (TRREB) districts which make up the GTA.

Between 1996 and 2021, over two million GTA homes have been sold, equal to a dollar volume of $1.1 trillion. The number of residential sales has grown 118.2 per cent between 1996 (55,779 transactions) and 2021 (121,712 transactions).

Meanwhile, the average home price has risen 453 per cent over the same 25-year period, with prices climbing from $198,150 in 1996 to $1,095,475 in 2021, a compound annual growth rate of 7.08 per cent.

“Performance of the GTA housing market over the 25-year period has been nothing short of remarkable,” said Christopher Alexander, president of RE/MAX Canada, in the report. “This is especially so when considering this time period was characterized by the tech meltdown of 2000, 9/11, SARS, the Great Recession of 2008, Ontario’s Fair Housing Plan and the on-going pandemic.”

New construction, transportation contributes to Toronto’s real estate growth
Upon examining TRREB’s market districts, RE/MAX’s Quarter Century report found that land availability, particularly within the city’s core, has “waned.” Meanwhile, migration, low interest rates and housing affordability have continued to play a critical role in the growth of the Toronto region.

In the last 25 years, Toronto Central, Halton Region, York Region, Simcoe County and Dufferin County have reported triple-digit sales increases, rising 156.9 per cent to as high as 1,123.7 per cent. Average GTA sale prices have also reached new highs in the last quarter-century, from a low of 301 per cent to a high of 874 per cent.

New construction has been a “significant factor,” in the sales gains seen throughout GTA regions such as Peel, Durham, Halton and York. The GTA’s 905 communities evolved to be affordable alternatives for freehold property purchasers, with starter homes on smaller lots enticing first-time buyers outside of the 416 area, RE/MAX Canada explained. Transportation initiatives like the expansion of the GO train system and 400-series highways have also supported growth, bringing new life to older cities like Milton, East Gwillimbury and Innisfil.

“If you build it, they will come, and they sure did,” said Alexander. “Bolstered by historically low interest rates, a strong economy, grit and determination, buyers both young and old have moved to the city’s bedroom communities.”

GTA housing and development to evolve with land availability
With land in limited supply within the GTA’s 905 areas, the emphasis is moving from freehold homes to high-density properties, RE/MAX Canada noted.

For instance, condos represent one in two sales within Mississauga, while more condo developments are in the works for areas like Brampton, York Region and Pickering’s City Centre.

“The GTA’s housing stock continues to evolve based on land availability. Builders and developers are faced with the harsh reality of a land supply-crunch as affordability remains top of mind with the vast majority of buyers,” said Alexander in the report.

Vertical growth has played a “significant role” in climbing sales levels within the 416 region, as condo apartments and townhomes now account for 76 per cent of sales in Central Toronto. Builders and developers look to existing buildings for potential demolition as many of the existing parking lots and vacant land have been bought up. In other cases, RE/MAX explains that developers have gutted and redeveloped existing structures for housing, such as The Britt in Toronto, formerly the Sutton Place Hotel.

“While the preference may be freehold, the necessity to build vertical communities has never been more apparent in a city where the population has grown by two million people since 1996 and is expected to ramp up in coming years,” said Alexander.

The pandemic, geopolitical tensions, and supply chain disruptions have thrown the world into disarray in recent years, but that hasn’t stopped the world’s ultra-wealthy population from growing at a strong clip.

New data from this year’s Wealth Report by Knight Frank shows that the number of Ultra-High Net Worth Individuals (UHNWIs) grew 9.3% between 2020 and 2021. Nearly all regions saw an increase in ultra-wealthy people over the time period.

The above visualization from the report explores the global distribution of uber-affluent people. Below, we’ll also look at how the populations are projected to grow in the future.

The World’s Ultra-Wealthy, by Region
UHNWIs are defined as having net assets of $30 million or more, including their primary residence.

With over 230,000 UHNWIs in 2021, North America has the largest subset globally, followed by Asia at nearly 170,000. Over the last year, the ultra-wealthy population rose 12.2% and 7.2% across these regions, respectively.

Following North America and Asia is Europe. In 2021, the top countries for the ultra-wealthy were France (30,000), Germany (28,000), U.K. (25,000) and Italy (17,000). On a per capita basis, Monaco is the highest worldwide, at five people per thousand residents.

Interestingly, the ultra-rich in Russia & CIS (6,500) grew the second fastest across all regions, at 11.2%. Rebounding oil prices, property prices, and stock market valuations likely bolstered this growth. However, the crippling sanctions and economic fallout resulting from the invasion of Ukraine could substantially impair oligarch wealth for many years to come.

Growing Fast
How will UHNWI populations change in the next five years?

Globally, the number of ultra-rich is projected to increase a staggering 28% by 2026. (Still, it’s worth noting that growth between 2016-2021 was almost three times this rate, at over 75%.)

Asia is projected to have the highest growth rate, along with Australasia. In five years, UHNWIs are set to rise 33% in both regions. Singapore is projected to see its ultra-rich population grow 268%, while the ultra-rich living in mainland China are anticipated to grow over 42%.

Meanwhile, North America is projected to see 28% growth, or reaching a total of 300,000 UHNWIs by 2026.

Significant growth is also projected across Latin America. Amid rampant hyperinflation, Argentina is estimated to see a 38% expansion in its ultra-wealthy population.

Behind the Scenes
What is fueling this growth in UHNWIs worldwide?

Sky-high asset prices and a real estate boom are two drivers behind this trend, according to Knight Frank. Ultra-low interest rates, which declined during the pandemic, is another.

Given cheap borrowing costs, the ultra-wealthy have more leverage to build their wealth, such as buying more property or investing in financial assets. In fact, the average UHNWI owns 2.9 properties.

It’s worth noting that strong GDP projections often underlie wealth projections. The IMF predicts that a post-pandemic recovery will be robust. However the crisis in Ukraine could pose meaningful risks to the global economy, especially for inflation and financial markets.

For instance, Russia contributes 12% to the global oil supply, a key factor behind inflation. At the same time, Ukraine supplies 90% of America’s neon—an essential material used in the semiconductor industry—which could further exacerbate supply chain issues.

Knight Frank just released the 16th edition of its Wealth Report along with the disclaimer that, with everything going on in Ukraine right now, this outlook is of “little relative importance” and kind of doesn’t matter in the grand scheme of things. In any event, it includes the latest edition of their Prime International Residential Index (PIRI 100), which looks at the annual % change in luxury residential prices around the world. The chart is interactive, but I screenshotted (above) the top risers and fallers.

Toronto is 4th in the Americas and 7th globally with a 20.3% year-over-year increase.

Miami is also no surprise and came in 4th globally.

The top three cities were Dubai, Moscow, and San Diego.

Thankfully though, the number two city is in serious jeopardy right now and I suspect that its position will look quite different next year.

Money will go where it feels safe and secure.


From the launch of the first iPhone, to the world’s population reaching seven billion people, a lot has changed in the past 25 years. In that same quarter-century timespan, the Greater Toronto Area’s housing market has also witnessed remarkable transformation.

In its Quarter Century Market Report released today, RE/MAX Canada says that home sales have doubled while prices have soared over 450 per cent in the GTA since 1996, growth that has been supported by market demand and limited home supply. The report examined home buying activity in the nine Toronto Regional Real Estate Board (TRREB) districts which make up the GTA.

Between 1996 and 2021, over two million GTA homes have been sold, equal to a dollar volume of $1.1 trillion. The number of residential sales has grown 118.2 per cent between 1996 (55,779 transactions) and 2021 (121,712 transactions).

Meanwhile, the average home price has risen 453 per cent over the same 25-year period, with prices climbing from $198,150 in 1996 to $1,095,475 in 2021, a compound annual growth rate of 7.08 per cent.

“Performance of the GTA housing market over the 25-year period has been nothing short of remarkable,” said Christopher Alexander, president of RE/MAX Canada, in the report. “This is especially so when considering this time period was characterized by the tech meltdown of 2000, 9/11, SARS, the Great Recession of 2008, Ontario’s Fair Housing Plan and the on-going pandemic.”

New construction, transportation contributes to Toronto’s real estate growth
Upon examining TRREB’s market districts, RE/MAX’s Quarter Century report found that land availability, particularly within the city’s core, has “waned.” Meanwhile, migration, low interest rates and housing affordability have continued to play a critical role in the growth of the Toronto region.

In the last 25 years, Toronto Central, Halton Region, York Region, Simcoe County and Dufferin County have reported triple-digit sales increases, rising 156.9 per cent to as high as 1,123.7 per cent. Average GTA sale prices have also reached new highs in the last quarter-century, from a low of 301 per cent to a high of 874 per cent.

New construction has been a “significant factor,” in the sales gains seen throughout GTA regions such as Peel, Durham, Halton and York. The GTA’s 905 communities evolved to be affordable alternatives for freehold property purchasers, with starter homes on smaller lots enticing first-time buyers outside of the 416 area, RE/MAX Canada explained. Transportation initiatives like the expansion of the GO train system and 400-series highways have also supported growth, bringing new life to older cities like Milton, East Gwillimbury and Innisfil.

“If you build it, they will come, and they sure did,” said Alexander. “Bolstered by historically low interest rates, a strong economy, grit and determination, buyers both young and old have moved to the city’s bedroom communities.”

GTA housing and development to evolve with land availability
With land in limited supply within the GTA’s 905 areas, the emphasis is moving from freehold homes to high-density properties, RE/MAX Canada noted.

For instance, condos represent one in two sales within Mississauga, while more condo developments are in the works for areas like Brampton, York Region and Pickering’s City Centre.

“The GTA’s housing stock continues to evolve based on land availability. Builders and developers are faced with the harsh reality of a land supply-crunch as affordability remains top of mind with the vast majority of buyers,” said Alexander in the report.

Vertical growth has played a “significant role” in climbing sales levels within the 416 region, as condo apartments and townhomes now account for 76 per cent of sales in Central Toronto. Builders and developers look to existing buildings for potential demolition as many of the existing parking lots and vacant land have been bought up. In other cases, RE/MAX explains that developers have gutted and redeveloped existing structures for housing, such as The Britt in Toronto, formerly the Sutton Place Hotel.

“While the preference may be freehold, the necessity to build vertical communities has never been more apparent in a city where the population has grown by two million people since 1996 and is expected to ramp up in coming years,” said Alexander.

The section on Science Centre Station at Don Mills and Eglinton has been updated with an illustration of the CreateTO proposal for the southwest and southeast corners.

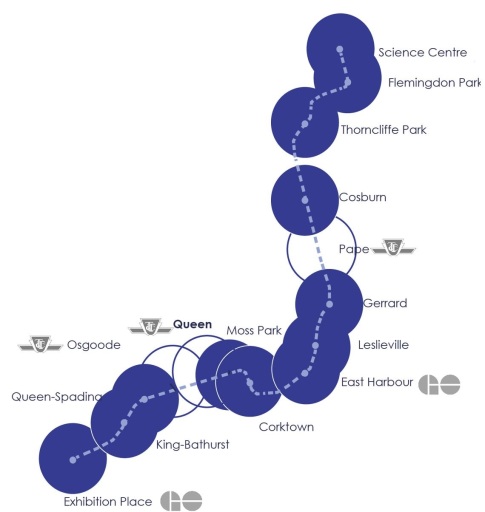
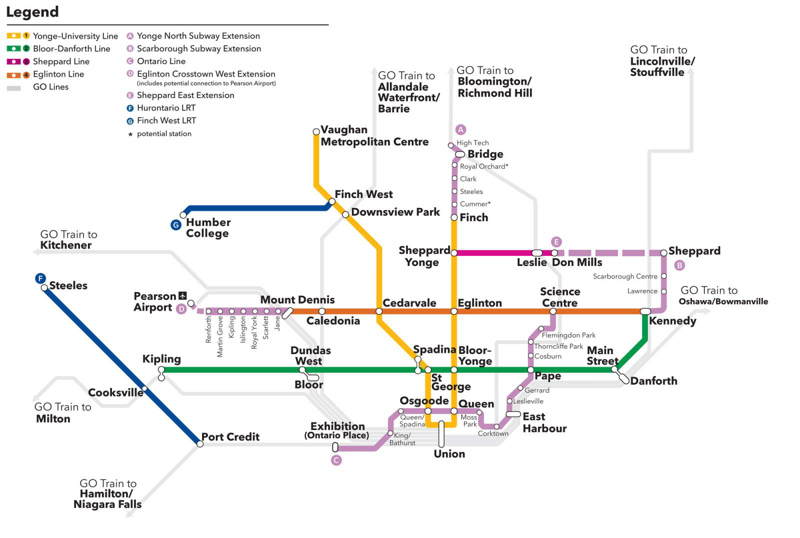
This article combines the speaking notes and presentation deck for my webinar An Ontario Line Tour that streamed on February 1, 2022 under the sponsorship of Smart Density, an Architecture and Planning firm in downtown Toronto. The image below was taken from the announcement of the webinar. It shows the stations on the Ontario Line with their zones of influence drawn as 500m circles around each of them.

Intro:

Thanks for coming today!

To set the stage for what will follow, here is a brief outline.

  • Origins of the Ontario Line
  • A station-by-station tour from Exhibition to Science Centre
  • Planning issues for rapid transit

Illustrations in this presentation come from many sources, but are preliminary in many cases, because the final EA is not yet published with what might be “definitive” (for now) designs.

Slide 1: DRL/OL map

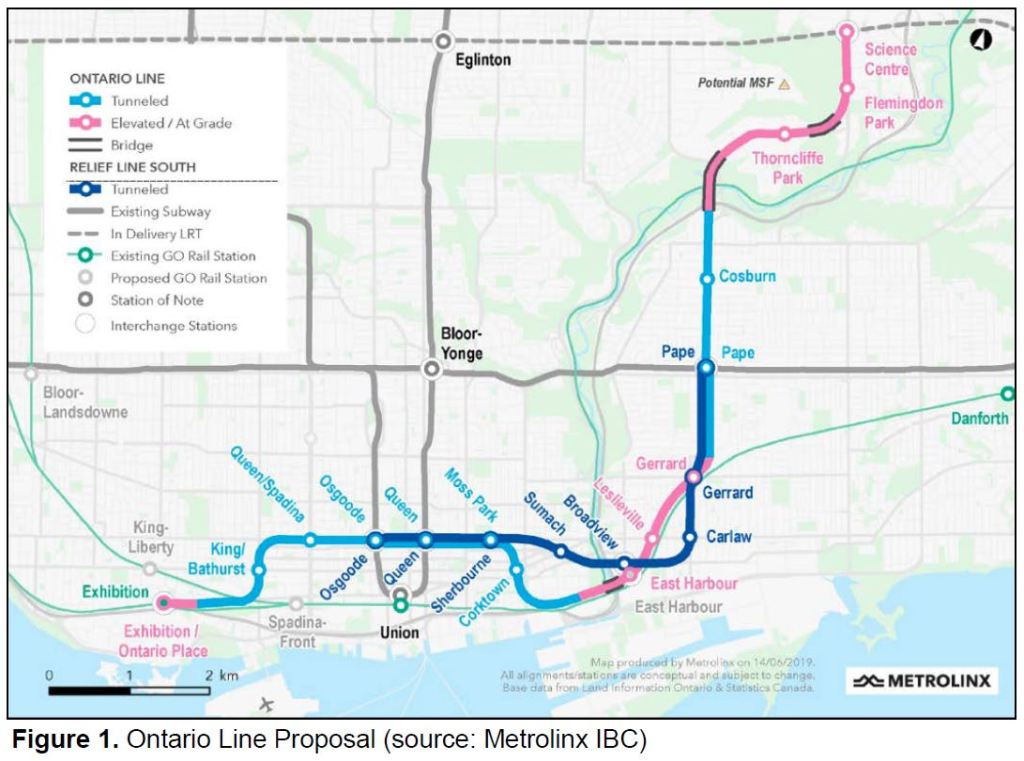
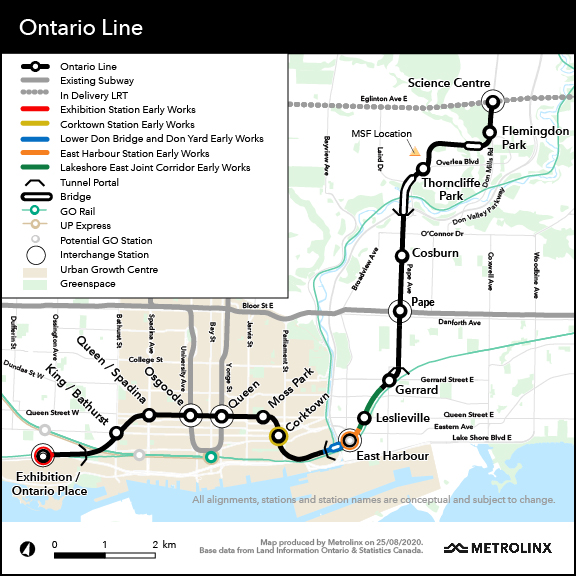
The Ontario line replaced the Downtown Relief Line after Doug Ford came to power at Queen’s Park. It follows in a long tradition of new governments tearing up old plans and starting over. On this map we see the Relief Line South in dark blue, and the Ontario Line in turquoise.

For many years, the Downtown Relief Line (DRL) was saddled with the name “downtown”, a poison pill to suburban politicians whose own rapid transit schemes took precedence. It didn’t help that even the TTC downplayed the need for another line into the core until pressure from the proposed Richmond Hill extension eliminated all doubt that more downtown capacity was needed.

The subway has filled up before: in the late 1980s there were severe congestion problems at Bloor-Yonge, but the recession of 1990-95 solved that as the TTC lost 20% of its ridership. More recently we faced another crunch through the 2000s combined with a renewed interest in a Richmond Hill subway. City Council is on record that without a Relief Line (whatever it’s called), the Richmond Hill extension is a non-starter.

This is the map Metrolinx typically displays when they want to talk about how much more rapid transit their proposal yields compared to the Relief Line. It perpetuates a Metrolinx Myth that the northern extension is their brain child, when in fact a line to Don Mills and Eglinton or beyond has been part of transit plans for over half a century.

Slide 2: TTC 1969 plan

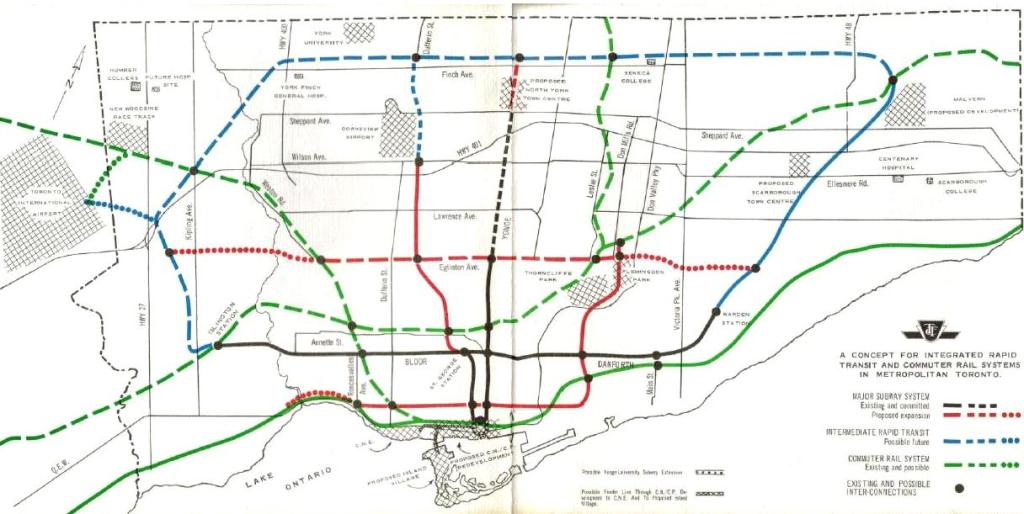
This is a plan the TTC published in the late 1960s. Notice how the suburban centres were “proposed” and did not actually exist yet. The idea was to build a network of LRT lines (using streetcars repurposed from the downtown system, and later by new cars).

This map looks very familiar with lines that are still on the drawing boards today. The important point here is that the proposed Queen Street Subway went to Don Mills & Eglinton over 50 years ago.

Slide 3: Downtown Rapid Transit Subway (2012)

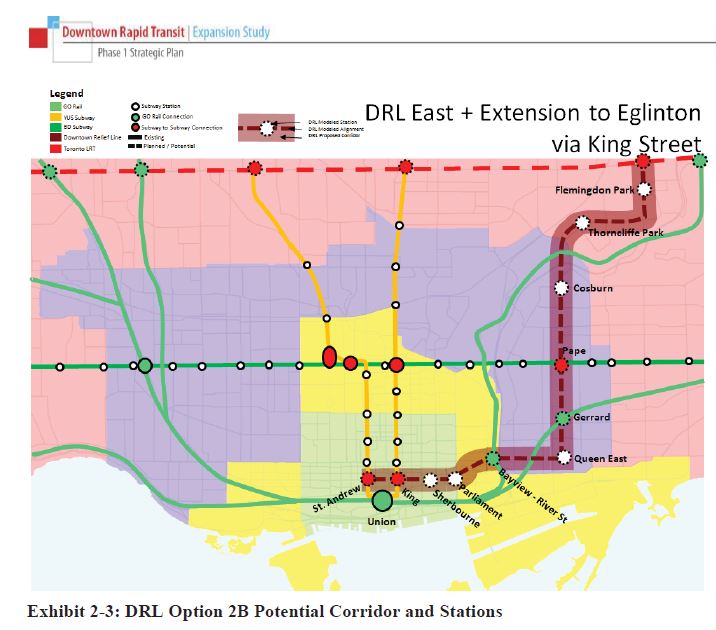
One version of the DRL from 2012 ran along King Street and north to Eglinton. It was subsequently shifted north to Queen. We can have a debate about which route would be better, but the point again is that the line went to Eglinton.

Because of the project’s size, the development work was divided between the City and the Province through Metrolinx. The City did the south portion from Pape to Downtown, while Metrolinx took on the north segment.

Slide 4: Corridor selection for the Relief Line North (2018)

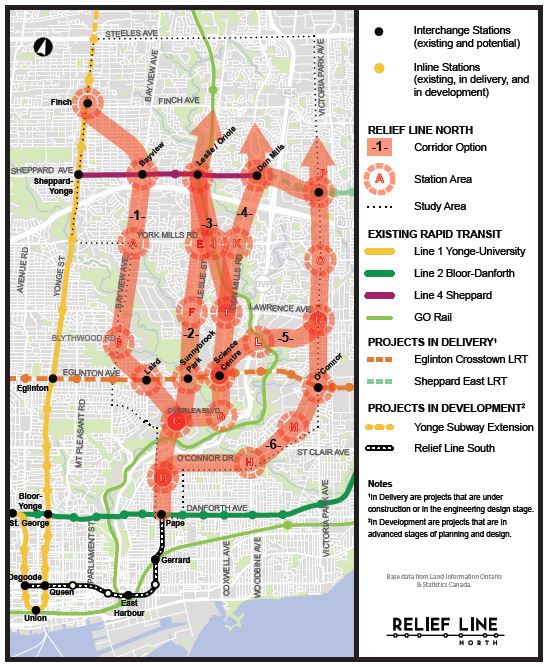
Metrolinx was slow out of the gate and became mired in corridor selection even though it is fairly obvious that few of the options shown in this map actually make sense. One might almost think that Metrolinx was killing time.

Of particular interest here is that the line was to be studied all the way to Sheppard based on demand projections that showed this would have a profound effect on demand for Line 1 Yonge.

When the writ dropped for the 2018 election, all work stopped. It never restarted, but instead Metrolinx turned internally to crafting a new plan for a new Premier.

After the OL announcement and enabling legislation to clear away all possible dissent, Metrolinx launched into work on the new Ontario Line linking Ontario Place and the Ontario Science Centre. The route was extended west and south to the Exhibition from Osgoode Station, rerouted through Riverside onto the railway corridor, and changed to an elevated alignment through Thorncliffe Park. I will look at these in more detail later.

Slide 5: Major Contracts and Timing

Having learned their lesson on Eglinton that a single gigantic project brings management challenges, Metrolinx broke up the Ontario Line into four sub-projects. The first of these are the “Early Works” which are all relatively small undertakings in five locations to set the stage for tunnelling, and to resolve physical conflicts with GO Transit before OL construction begins.

There is a separate contract for the rolling stock, systems operations and ongoing maintenance (aka “RSSOM” for short).

This is a different setup from the Eglinton Crosstown line where that RSSOM functions were bundled with the construction project requiring each consortium to assemble its own team of systems providers and operators.

Ontario Line Construction Staging

  • Multiple segments with separate contracts
  • Early Works
  • In progress or about to begin
  • South Civils – Tunnels and Stations west of the Don River
  • RFP issued Dec 2020, Execution Oct-Dec 2022
  • “RSSOM” – Rolling Stock, Systems, Operation & Maintenance
  • RFP issued Dec 2020, Execution Oct-Dec 2022
  • Includes Maintenance & Servicing Facility at Thorncliffe Park
  • North Civils – Tunnels and Stations east of the Don River
  • RFQ to be issued July-Sept 2022, Execution July-Dec 2024
  • Opening 2030-ish
  • Pre-requisite for Richmond Hill Subway Extension to free capacity on Line 1

Note that the award dates for the three big projects are all after the 2022 election, and the north civils contract has not even reached the Request for Qualifications stage.

Metrolinx has recently adopted a more collegial tone about its relationship with P3 partners, and is shifting to a model where project risk is shared rather than being foisted entirely on the builders. Metrolinx hopes that this will make for smoother progress on the OL compared to Eglinton.

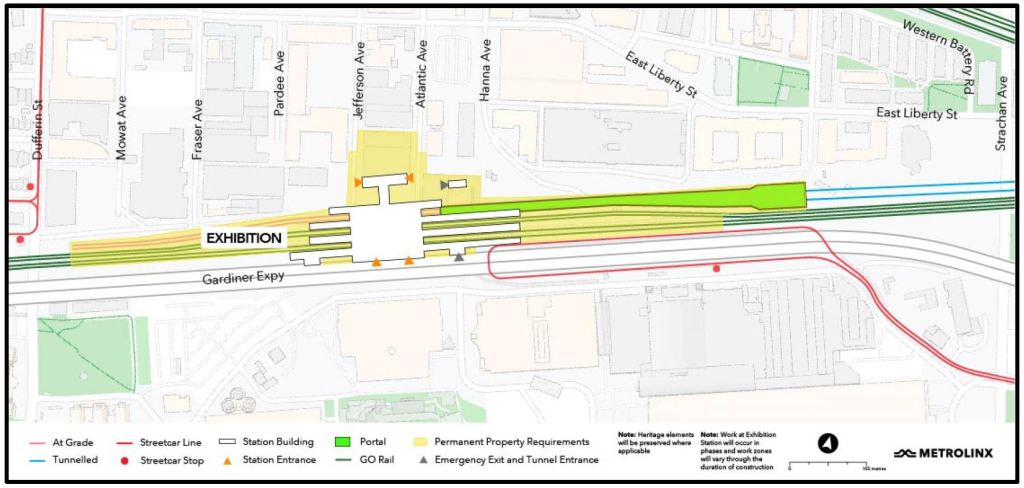
Slide 6: Early Works

There are five components to the Early Works, most of which involve locations shared by GO Transit and the OL:

  • Exhibition Station (red): GO trackage must be realigned to suit the new station design.
  • Corktown (yellow): This is not just a station site, but also the tunnel boring launch site comparable to those we saw on Eglinton east of Brentcliffe and at Black Creek.
  • Don River Bridge (blue): Work here includes not just a new bridge over the Don, but also realignment of tracks in the GO yard west of the river to make room for the Ontario Line’s portal.
  • East Harbour Transit Hub (orange): This will be a new major station including platforms for GO and the OL, as well as an interchange with the future Broadview Avenue extension and streetcar service connecting south into the eastern waterfront.
  • Joint Corridor (green): In order to fit both an expanded GO Transit (4 tracks instead of 3) and two tracks for the OL, the corridor between East Harbour and Gerrard will undergo substantial modification. I will deal with that later in the presentation.

Slides 7: Exhibition Station:

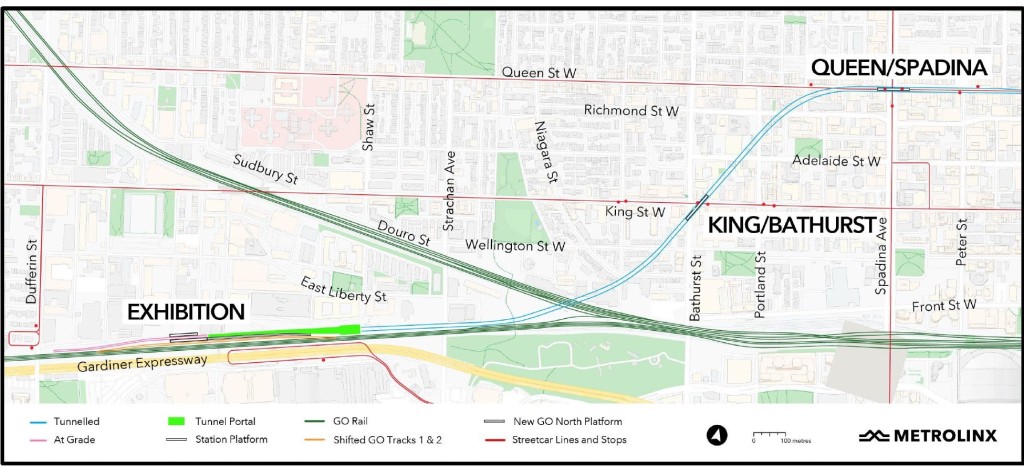
Exhibition Station is the western terminus of the Ontario line, a transfer point with the Lake Shore West GO corridor, and, of course adjacent to the CNE lands and the south end of Liberty Village.

The station will be at grade just north of the GO tracks. The portal (green on the map) leads into a deep tunnel that will run in bedrock under downtown. This avoids complexities with existing buildings and utilities, but makes for very deep stations, typically 40m down to platform level.

The original plan for this station was for the OL tracks to “straddle” the GO station in order to simplify GO Transit transfers, but his proved impractical. A similar problem affected the original design at East Harbour.

The tunnel portal will also be a launch site for TBMs assuming that there will be a drive east from Exhibition.

Slide 8: Exhibition Station Development

Infrastructure Ontario has produced sample plans for development around Exhibition Station. While this is fairly large, the extended Liberty Village around it is much bigger. I will return to Liberty Village and how it fits with various transit proposals later.

Proposed development:

  • Atlantic Avenue: 21 + 19 storeys
  • Jefferson Avenue: 2 x 19 storeys

Slide 9: King/Bathurst & Queen/Spadina Stations

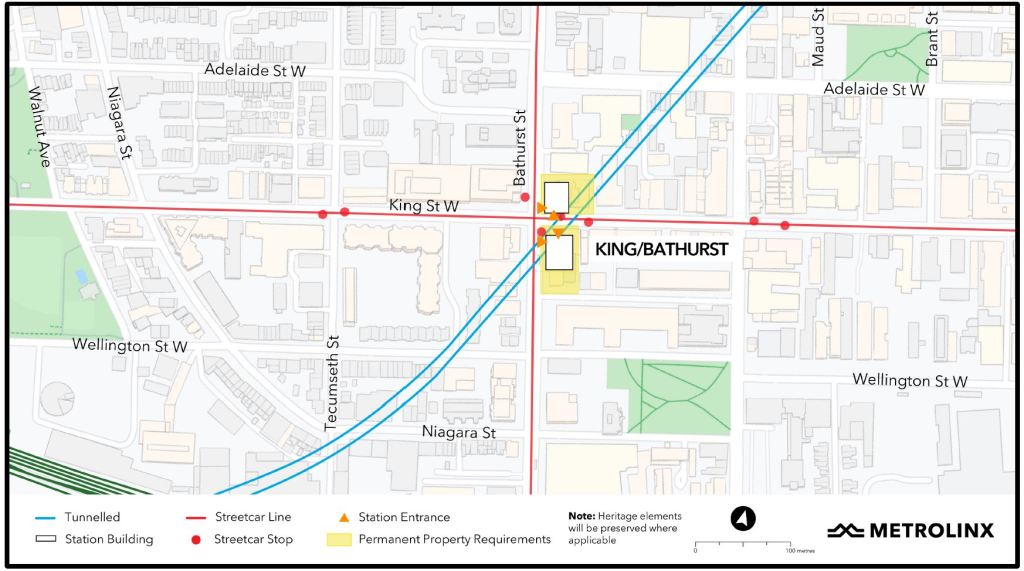
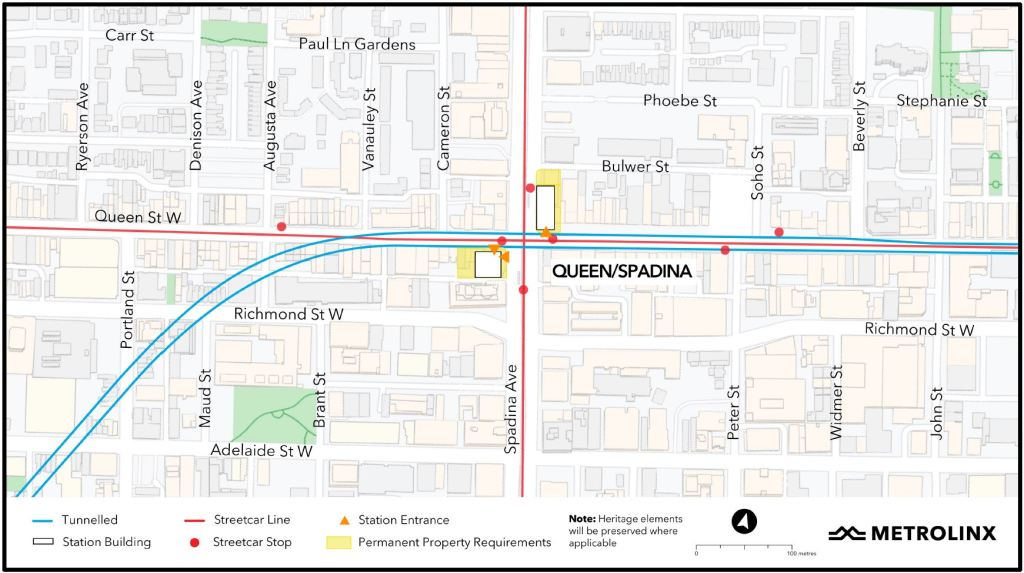
These stations share characteristics:

  • They will be mined from shafts dug down to the tunnel from two corners of the intersection. The shafts will become entrances.
  • In three of four cases, existing buildings have facades that will be preserved as part of new development.
  • Surface transit will not (mostly) be disturbed during construction.

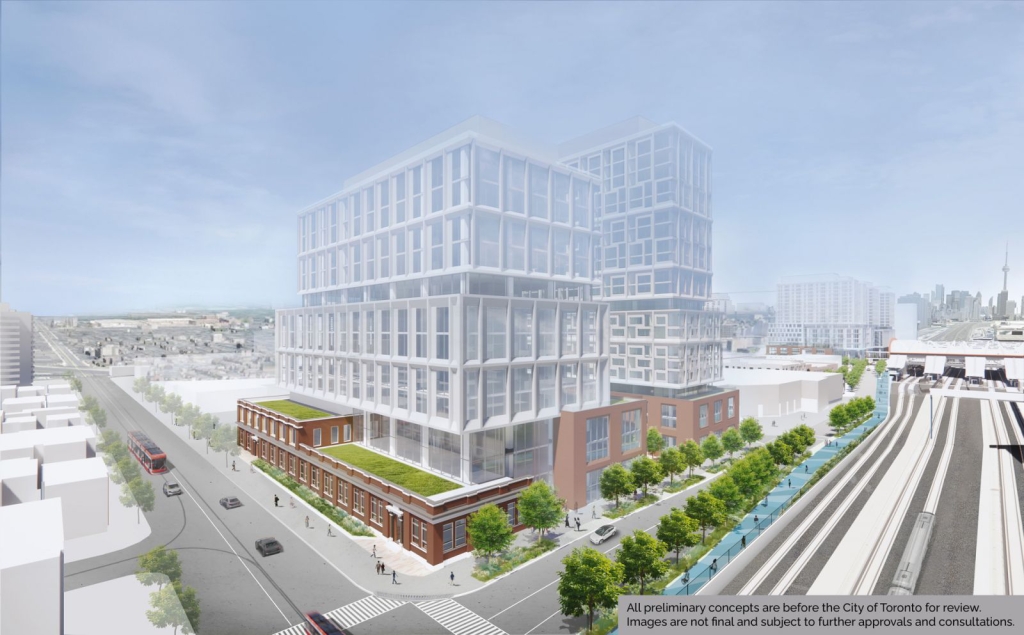
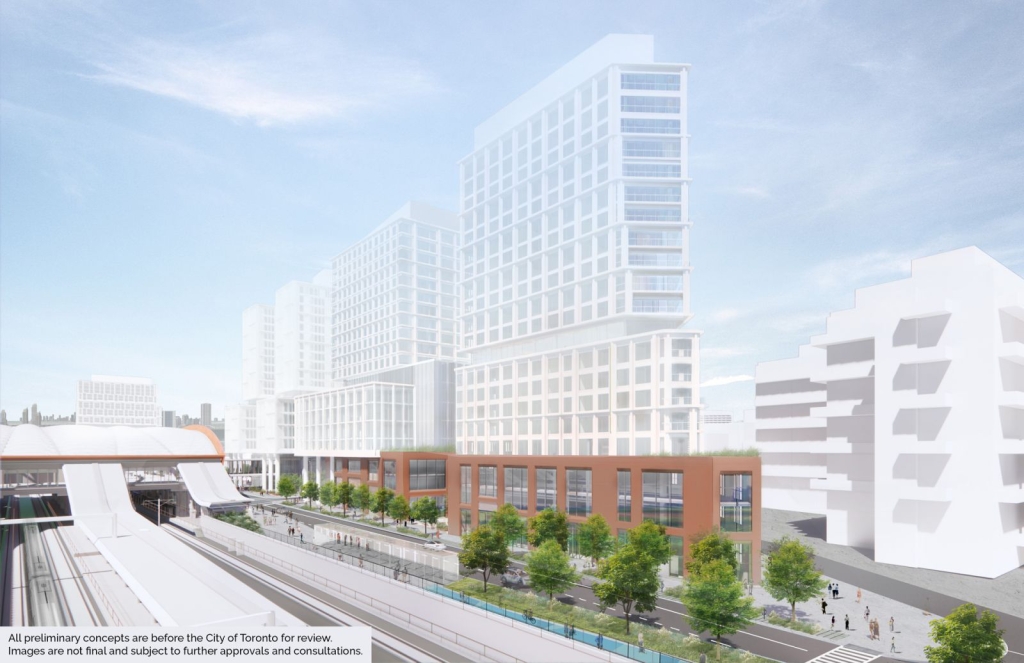
Slide 10: King/Bathurst and Queen/Spadina Development

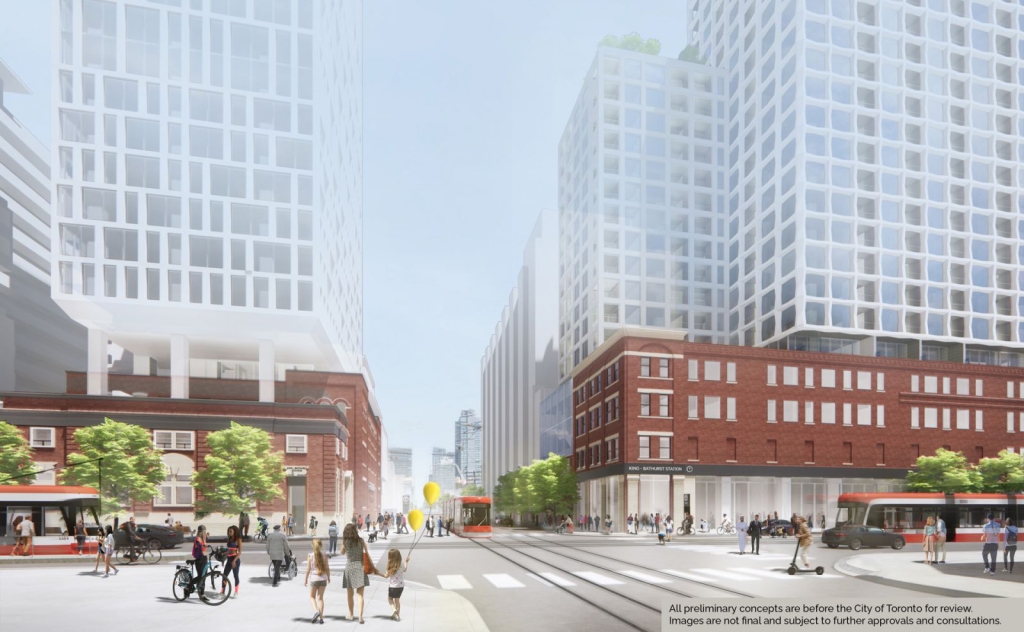
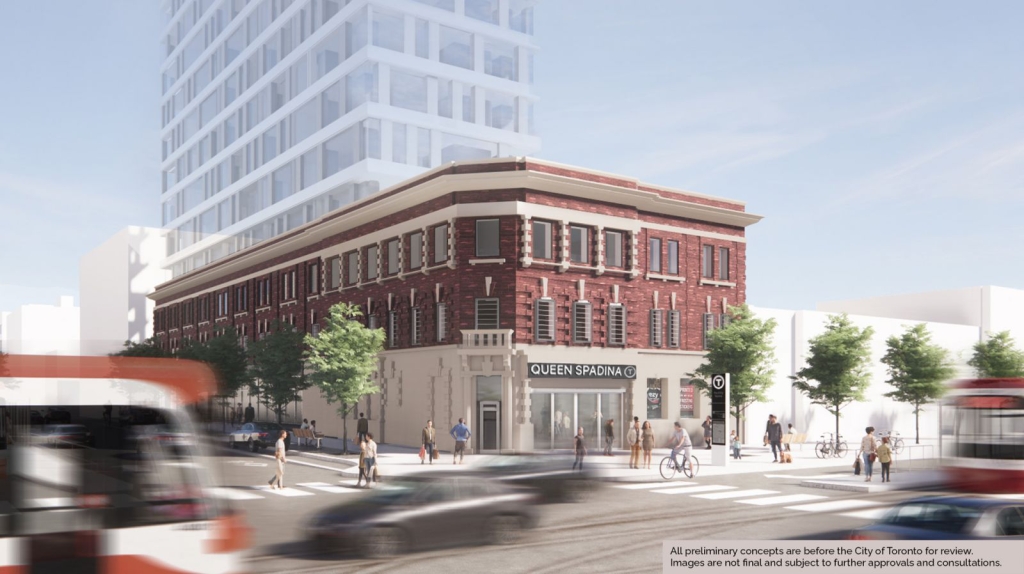
Proposed developments:

  • King/Bathurst
  • 2 x 25 storey
  • Queen/Spadina
  • Northeast: 15 storey
  • Southwest: 14 storey

Slide 11: Osgoode Station

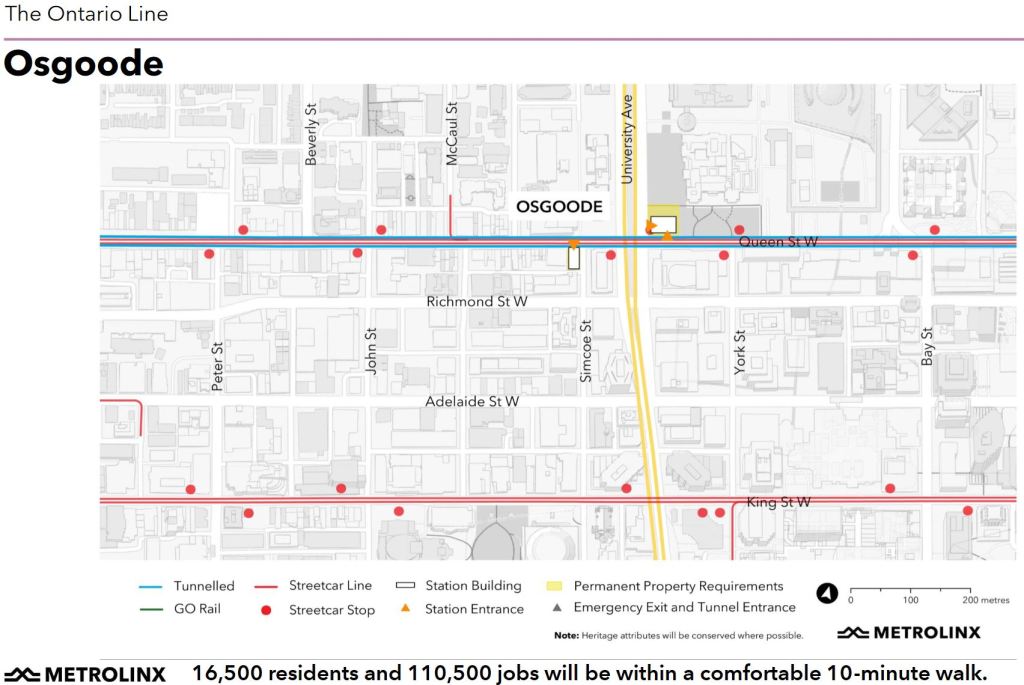
Osgoode is an interchange station with the University Subway, but unlike the proposed connection at Yonge (about which more in a bit), current plans call for the OL station to be built under the existing line by mining from either side, not by excavating the entire street. The two access points will be on the southwest corner of Queen and Simcoe, and the northeast corner at University.

Metrolinx has yet to produce any drawings of how the new and existing stations will work together, or how simple transfer connections will be.

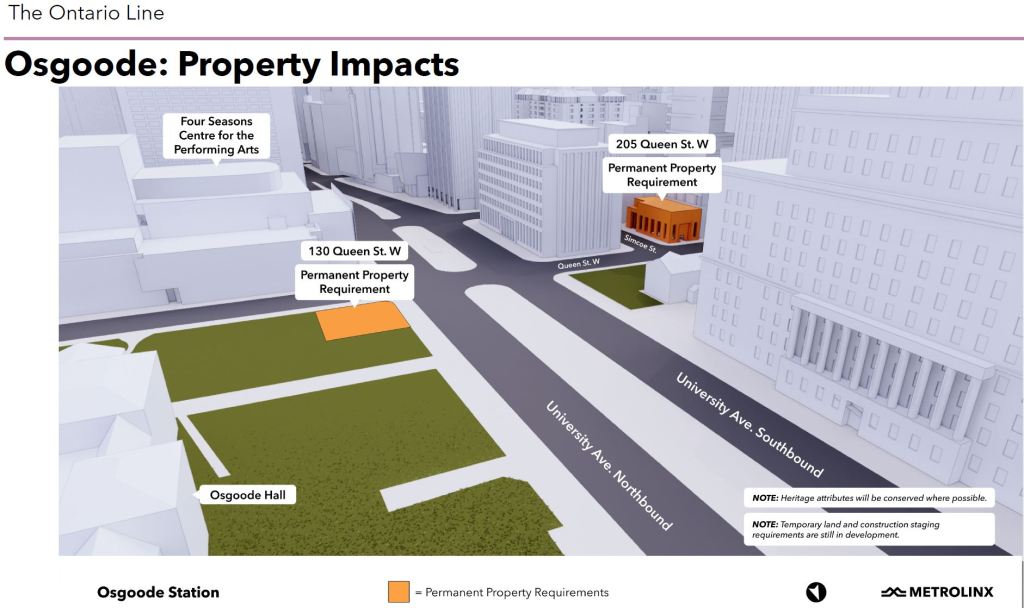
Slide 12: Osgoode Hall Park

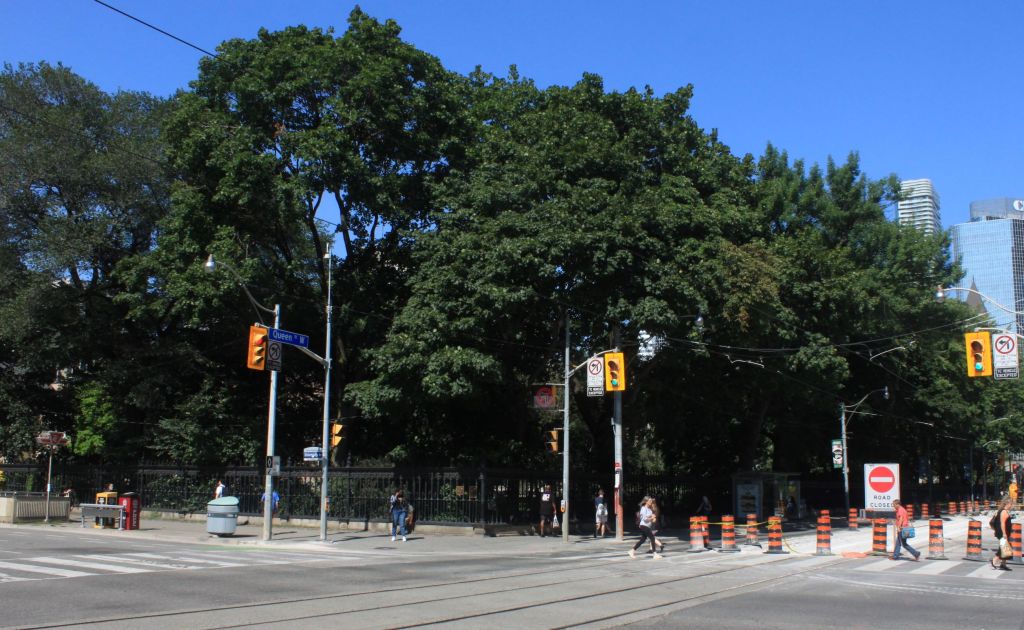
The design puts the station entrance in conflict with the park at Osgoode Hall, and there has, strangely, been almost no public comment about this. Lands west of the Hall and north of Queen will be used as a material staging area.

The original RL station was located further east with its entrances on the northwest corner at University (the grounds in front of Campbell House), and at the Queen & York intersection. In the Metrolinx revision the station box was shifted west.

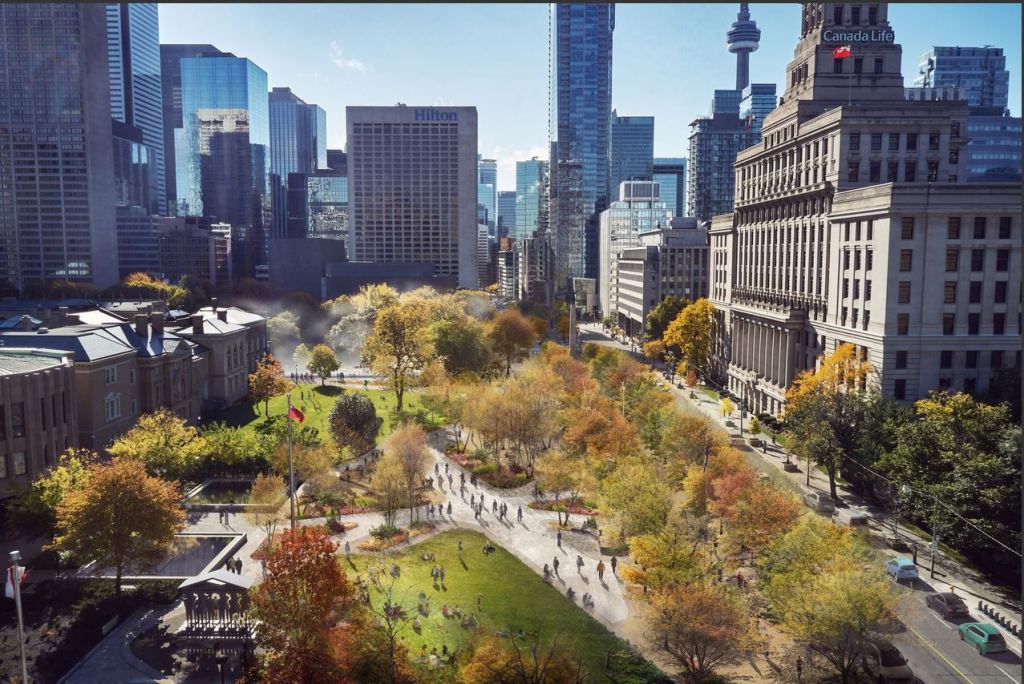
Whether a proposal to convert the east lanes of University Avenue to a park will ever occur remains to be seen. This would effectively shift the space now occupied by the median to the east curb and extending the sidewalk area.

Slide 13: Yonge/Queen

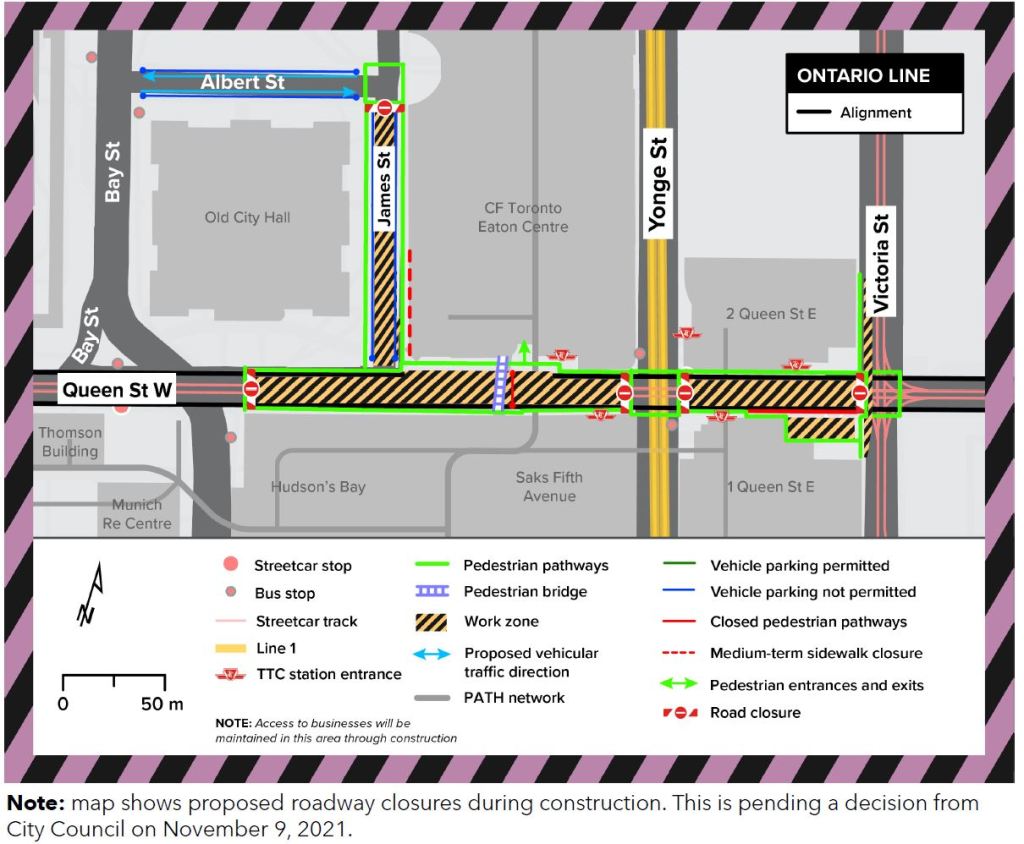
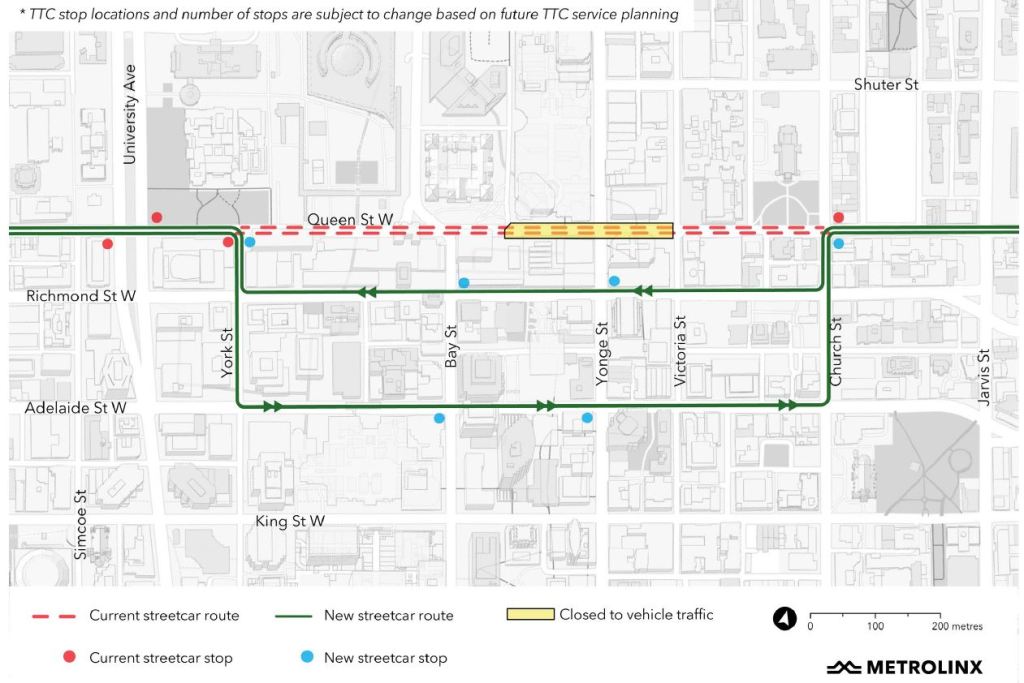
Queen/Yonge Station will be one of the largest single construction sites on the Ontario Line. It will be built with a deep excavation stretching from James Street on the west to Victoria Street on the east. Queen Street will be closed to traffic for over four years, from from May 1, 2023 to November 30, 2027, and streetcars will divert between Church and York Streets.

Yonge Street will remain open crossing Queen.

York will be changed to two-way operation to make this possible. Track on Adelaide will be rebuilt this year to permit operation between Spadina and Church so that diversions are possible over a wider area, notably around TIFF at King and John.

Slide 14: Yonge/Queen Cross-Section


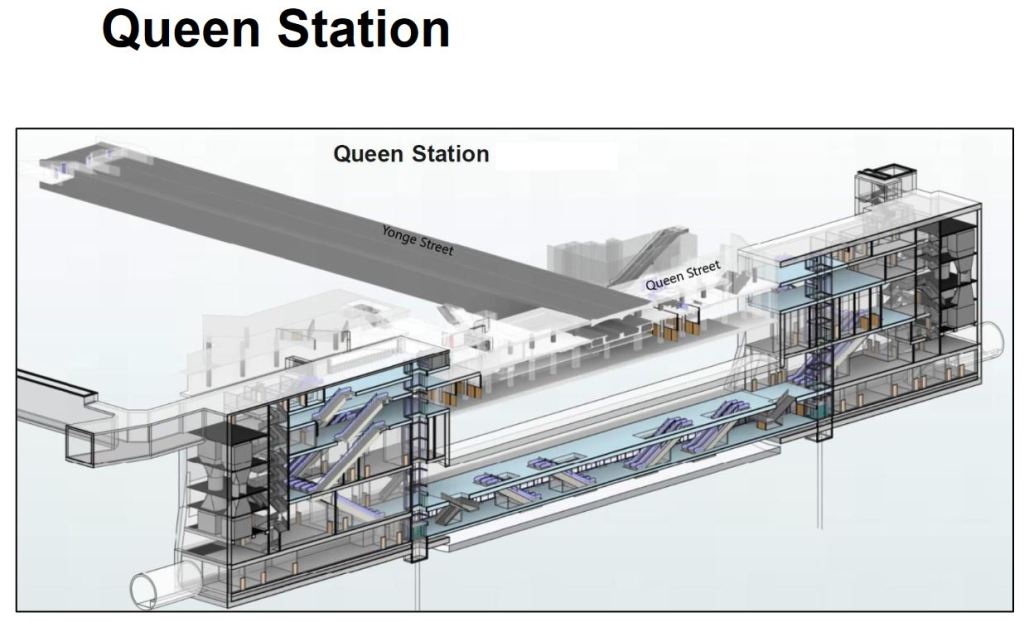
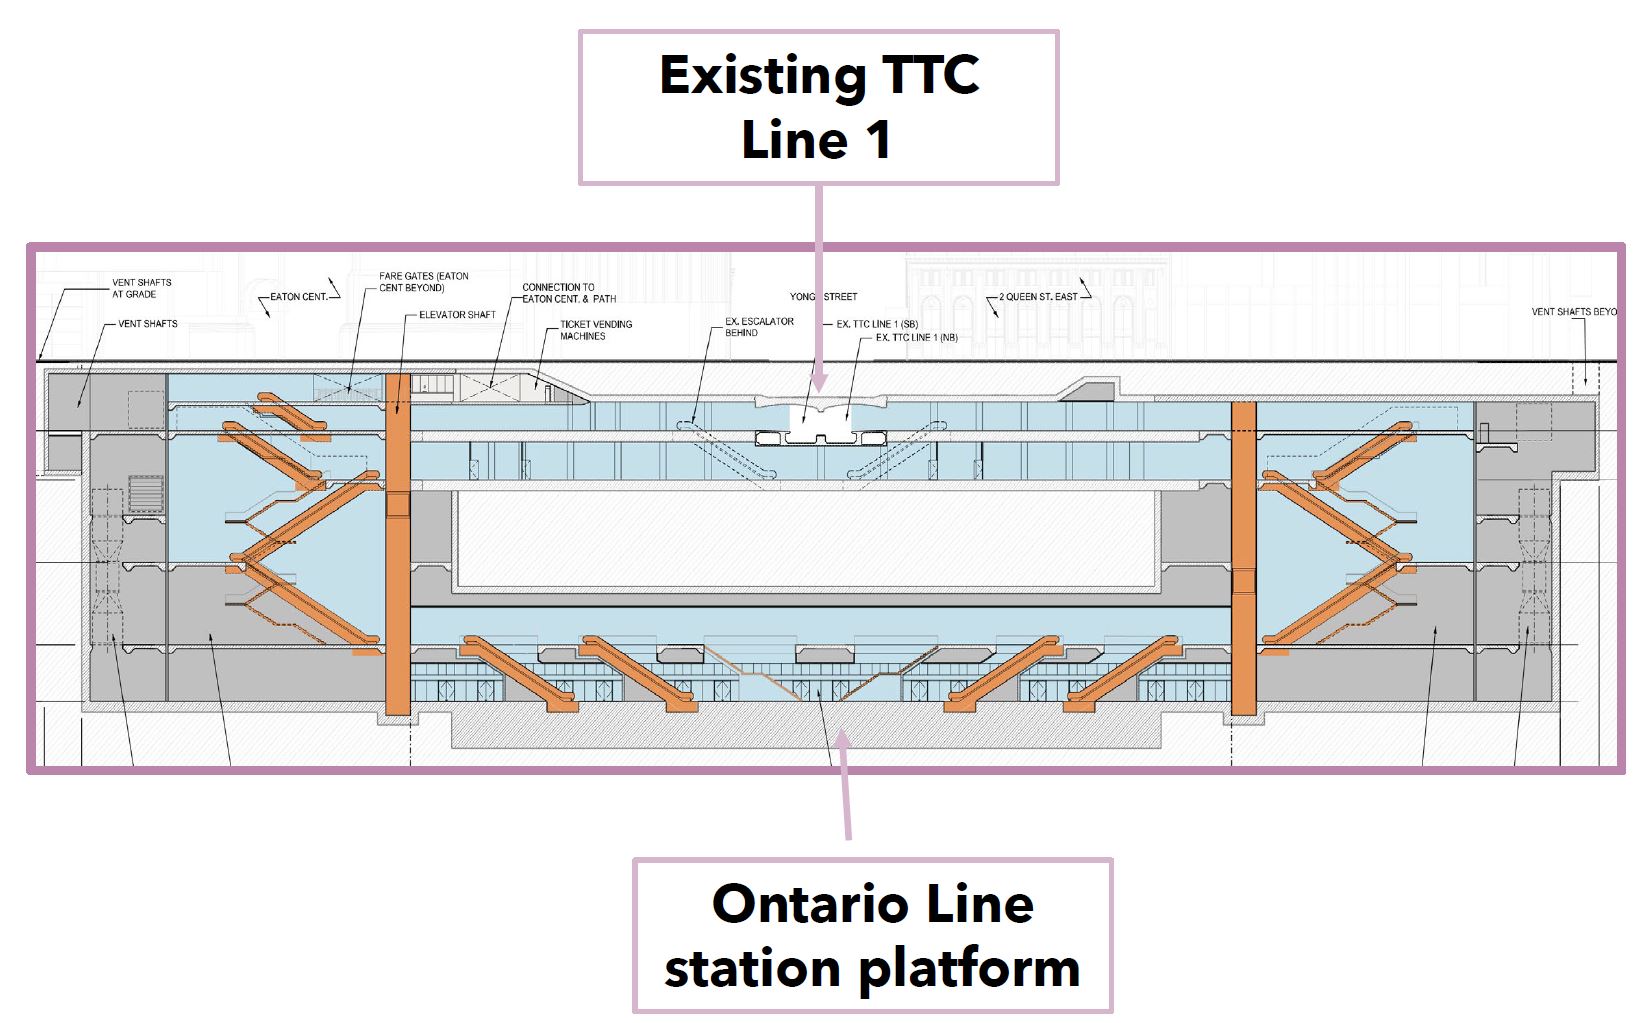
In the cross-section view, the large open block in the centre of the drawing appears as open space, but it is an unexcavated section in bedrock. This will support the existing subway structure while the OL is tunnelled under it. Just above that block is the existing underpass between the northbound and southbound platforms at Queen Station. This was a fragment “prebuilt” for a Queen Street subway 70 years ago, and it will become part of the upper concourse level of the new station.

The station is very deep, one level deeper than the originally proposed “City Hall” station on the RL. Access to the OL station will be via two stair/escalator/elevator towers east and west of the platform.

Moving between the two stations requires walking through the concourse some distance east or west of Yonge Street, travelling vertically by a series of escalators, and then back toward Yonge onto the Ontario Line platform. This will make transfers between the OL and the Yonge line much longer than the kind of transfer we are used to at Bloor-Yonge or St. George. There is some irony in Metrolinx’ focus on simple, fast transfers at East Harbour and Exhibition.

Slide 15: Moss Park/Sherbourne


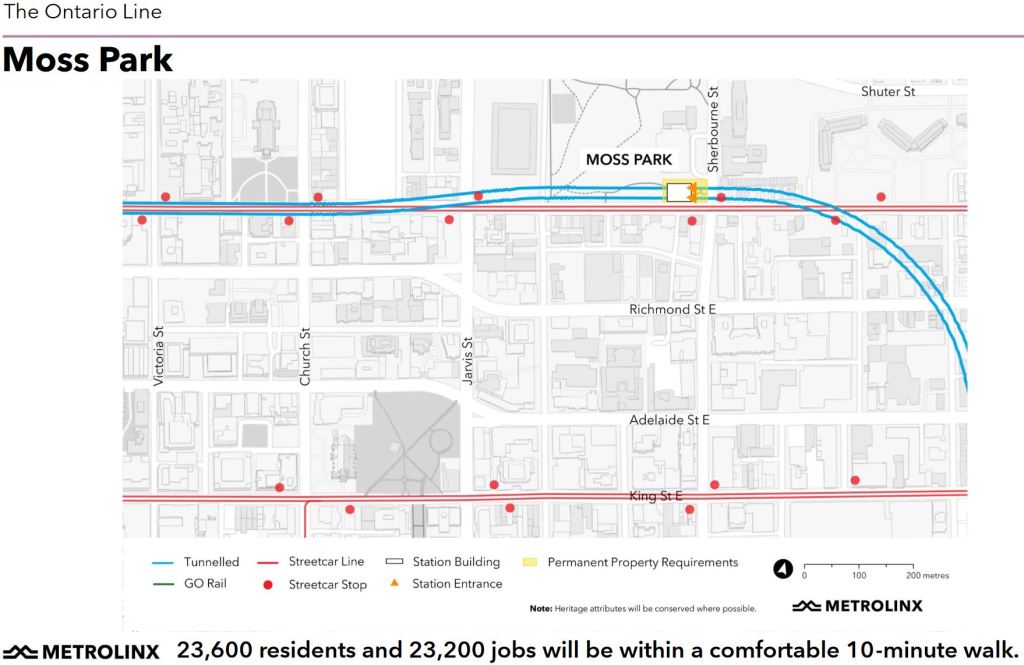
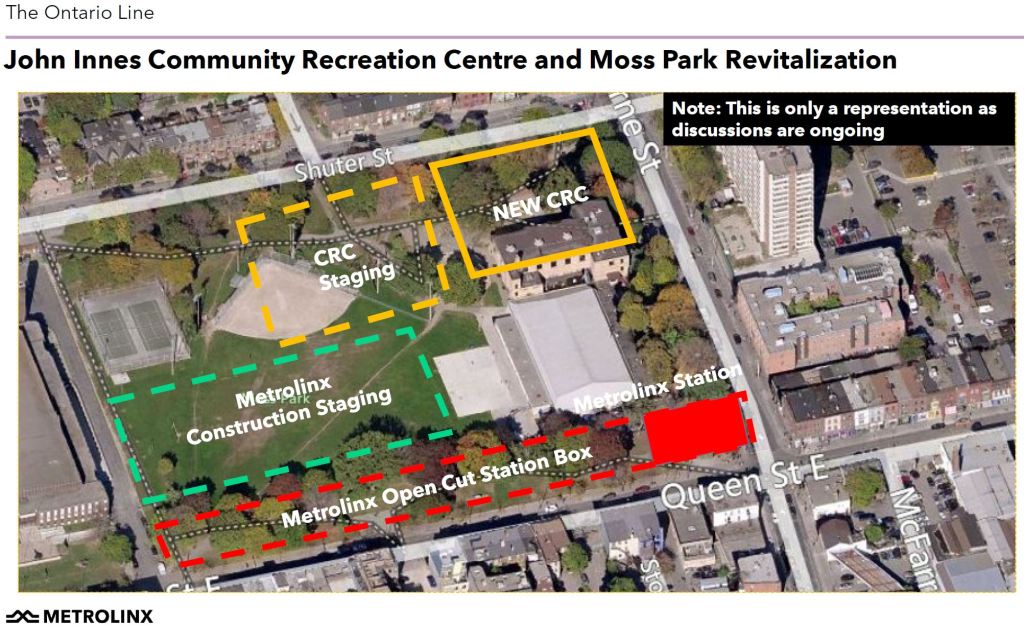
Moss Park Station will be under the park on north side of Queen west of Sherbourne. No “Transit Oriented Community” development has been proposed here because the lands will remain for parkland and community use. However, redevelopment of the old industrial area has been spreading north from the St. Lawrence neighbourhood toward Queen Street. It would be reasonable to expect land near Moss Park Station to see major changes.

As at Spadina and University Avenues, construction of this station will not interrupt operation of the streetcar services on Queen.

Slide 16: Corktown

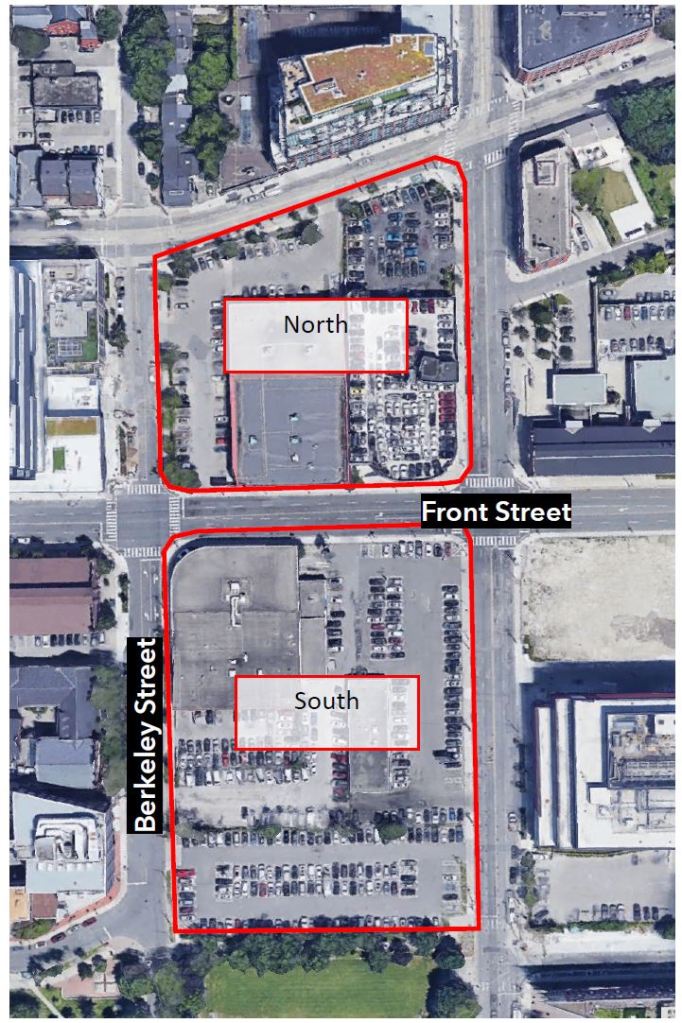
From Moss Park to Corktown Station the OL turns south to run between Parliament and Berkeley Street. The north block from King to Front will have the station entrance, while the block south of Front will be the tunnel boring launch site. Tunnel boring will proceed north and west from here, as well as for a short tunnel south and east toward the Don River.

The construction will not interfere with the streetcar services running along King Street.

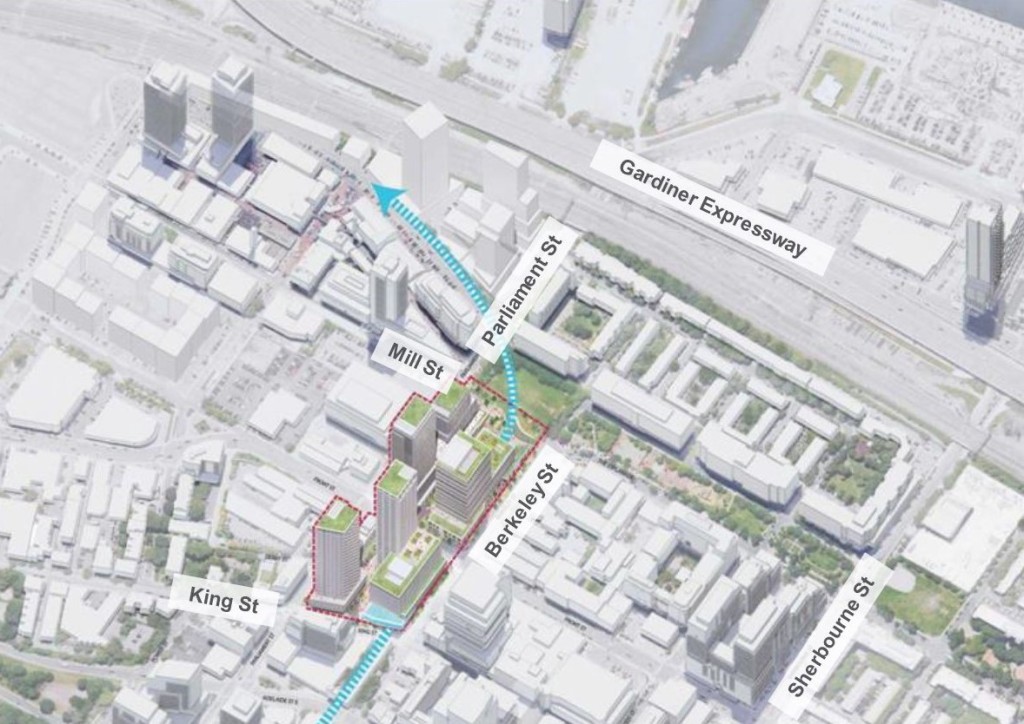
Infrastructure Ontario has major plans for these blocks with five primarily residential towers. This land, the site of the First Parliament of Upper Canada, was originally assembled by the City. Archeological exploration of the site has been underway for a few months.

Proposed: North site: 2x 46 stories; south site: 46+25 storey + 24 storey office

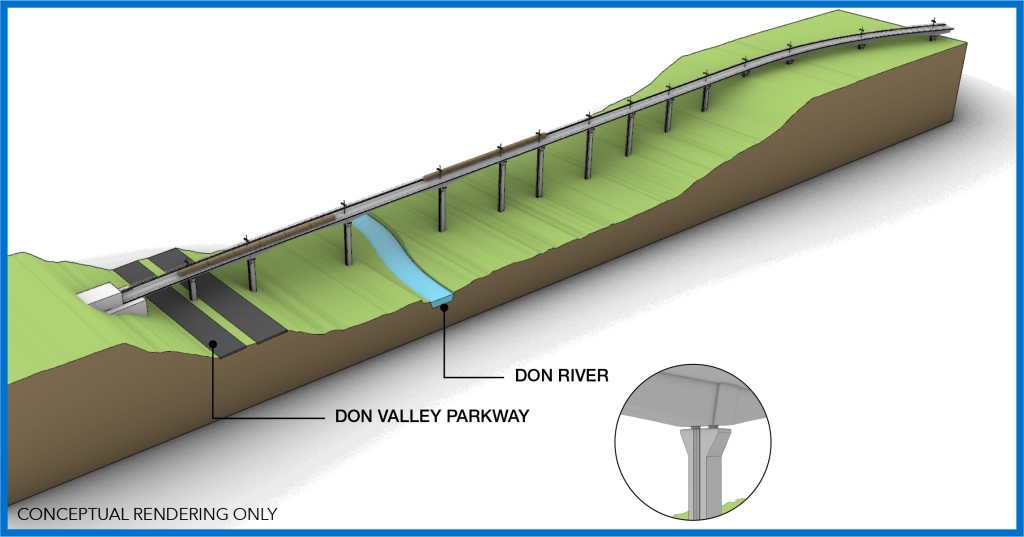
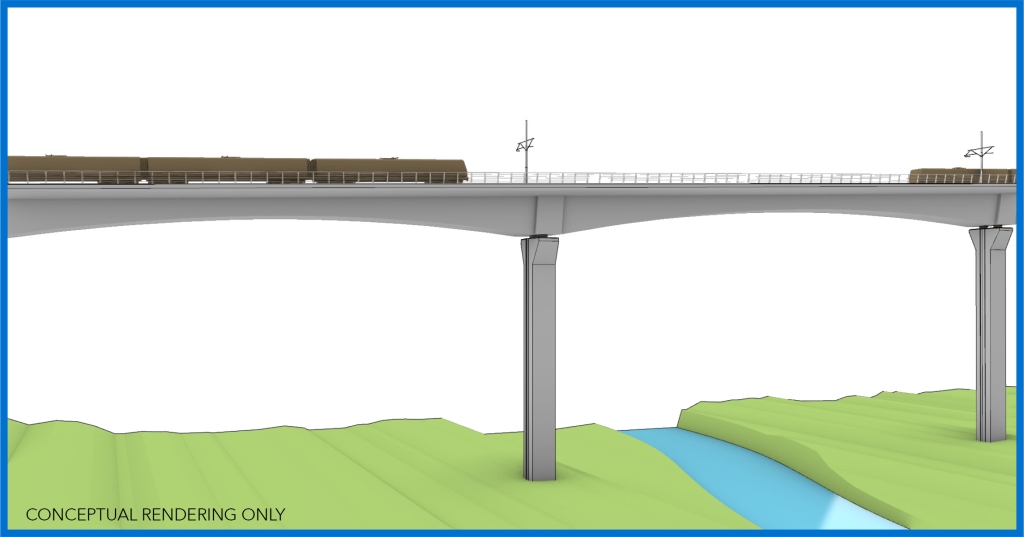
Slide 17: Don River Crossing

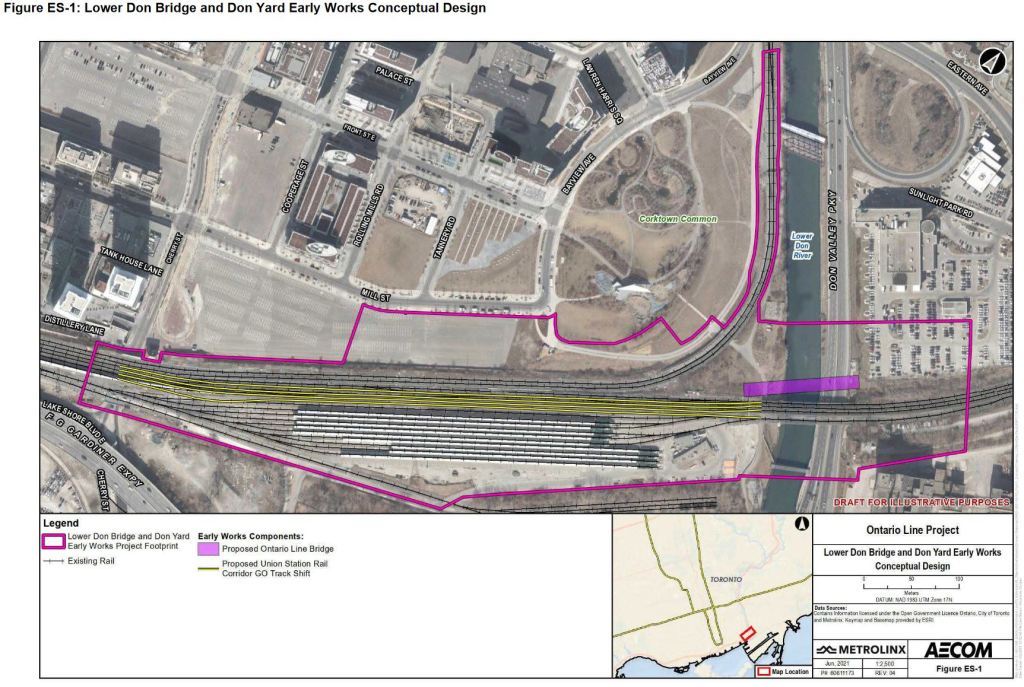
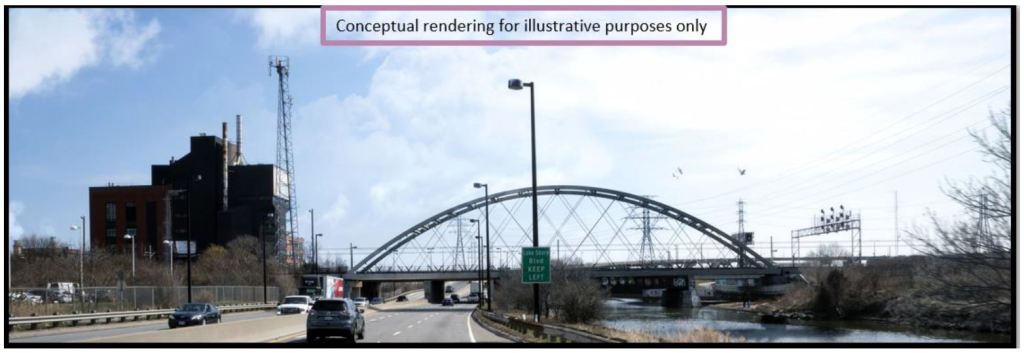
The Ontario Line will cross the Don River on a new bridge north of the existing railway line (purple block on the map). There will be adjustments to tracks in the GO Transit yard west of the river so that the Ontario Line can surface in between the main block of tracks in the Lake Shore East corridor and the tracks leading north to the Richmond Hill line.

North of the rail corridor and east of Cherry Street, a new development has been proposed just east of Distillery Loop (lower left corner of the map). This triggered recent debate on Twitter about a possible Cherry Station on the Ontario Line to directly serve the Distillery District. Such a change in the design is quite unlikely given the advanced state of the South Civils procurement. Ideally, if there were to be a station here, the excavation should be done concurrently with the adjacent development.

Slide 18: East Harbour Station

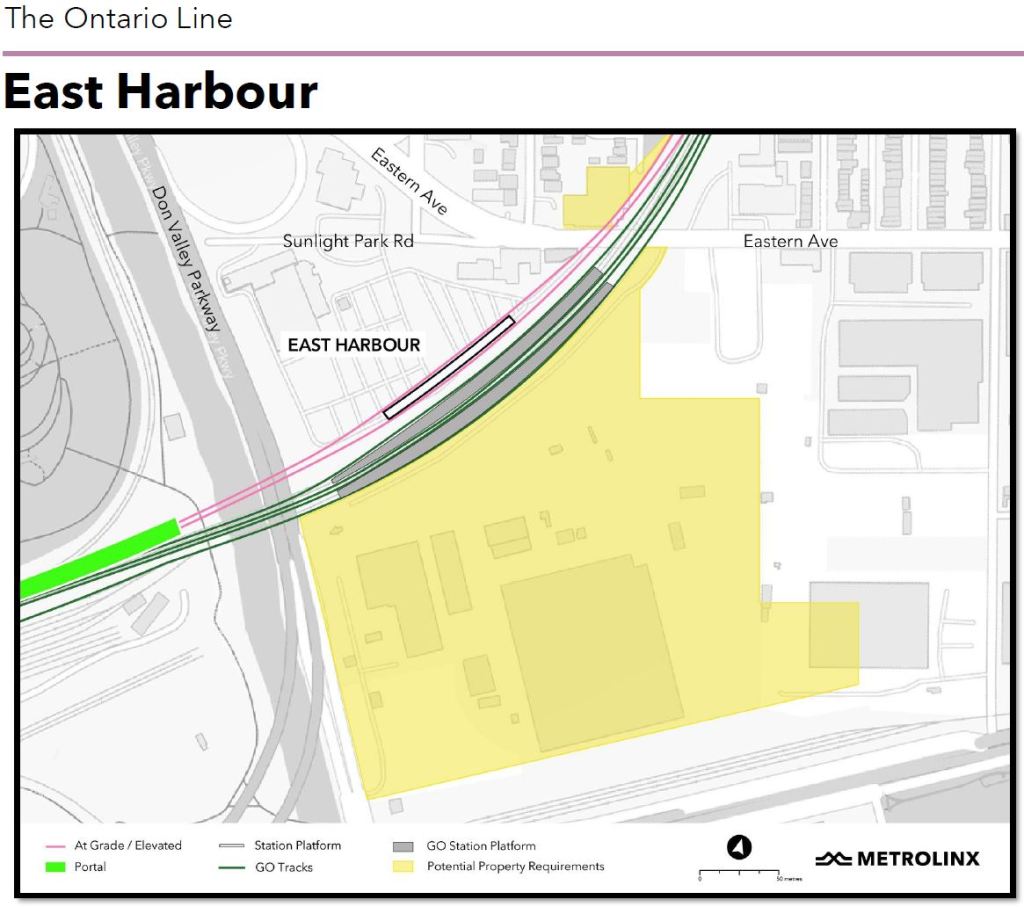
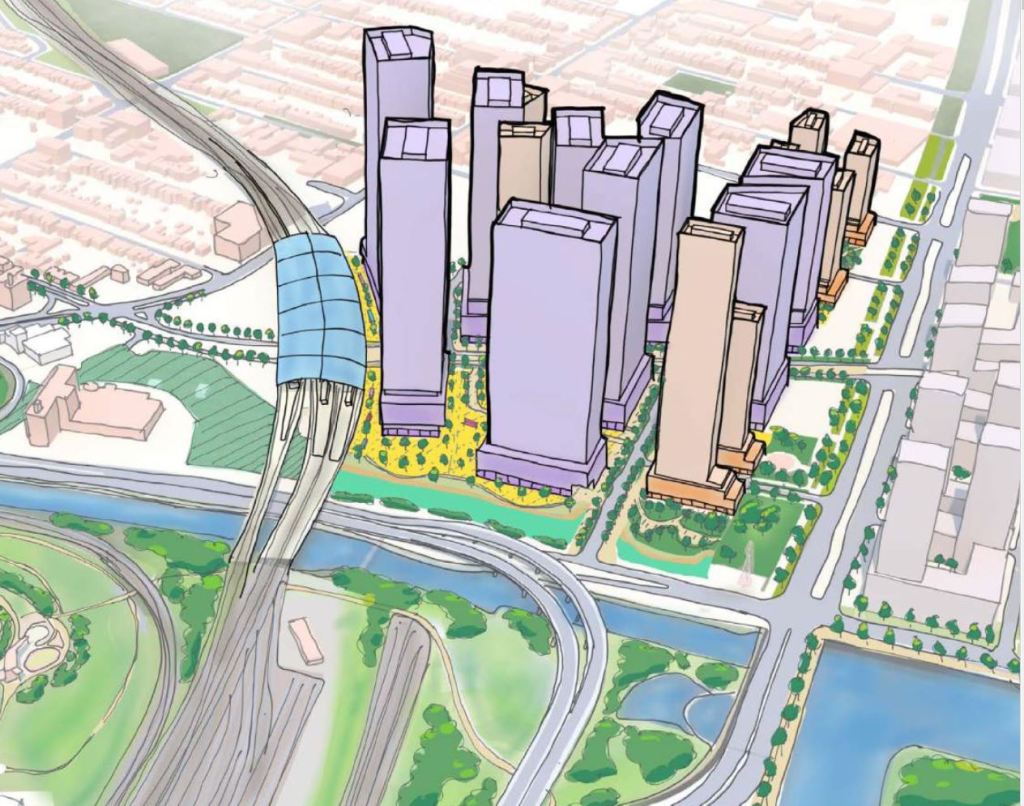
East Harbour (the old Lever Brothers site) will see major development in coming years. This was originally a Great Gulf project, and it has been taken over by Cadillac-Fairview. All of the proposed new buildings are south of the rail corridor, and they range from the mid-30s to over 50 stories in height. The full plan envisions about 302k sq m of residential space and 926k sq m of commercial. One obvious issue here will be the staging of residential versus commercial space, and the market for either of them in coming years.

An MZO is expected in Spring 2022 to enable this development.

Slide 19: East Harbour and Environs

There is a Transit Hub at East Harbour that will include a new GO station, the Ontario Line and the planned extension of Broadview Avenue including streetcar service.

The original design had the OL straddle the GO platforms to permit across-the-platform transfers, but as at Exhibition this turned out to be impractical. Now the OL tracks are on the north, GO to the south, and transfers via a concourse below.

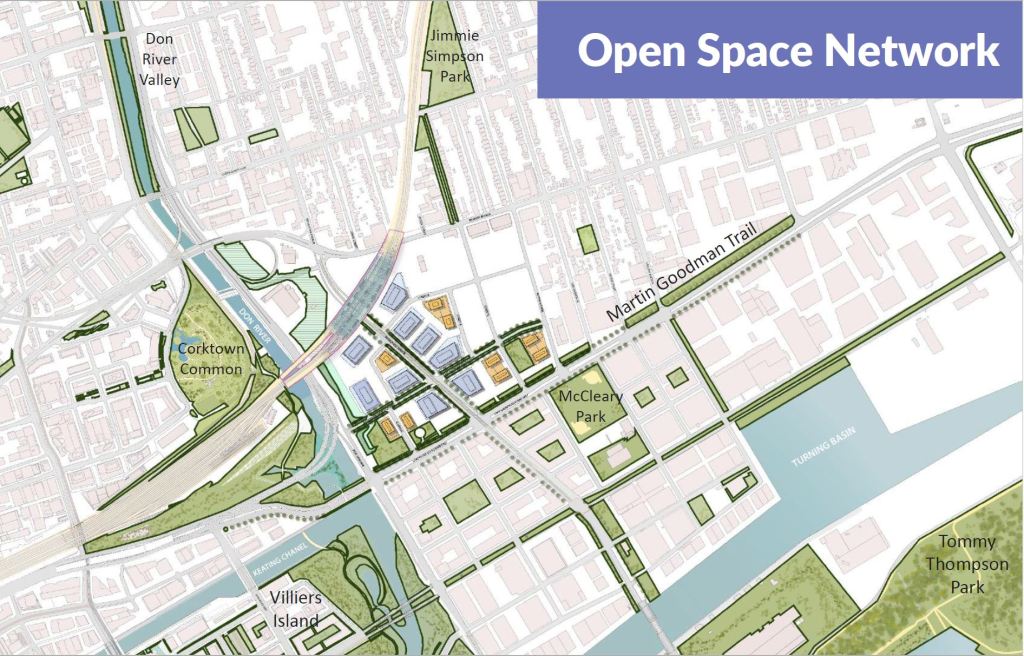
I have also included a wider view of the area in the Open Space overview from the CF proposal to show how this relates to other pending changes including the Broadview Extension, the Don Mouth reconstruction, Villiers Island and the development blocks along the north side of the Keating Channel. Road layouts include the revised Gardiner/DVP connection, and realignments of Queens Quay, Lake Shore Boulevard and Cherry Street. Any discussion of this area should be in the context of plans that have been underway for several years, not on the current layout.

Additional transit changes here include the Waterfront East LRT extension (more details of which are expected to come to Council soon), the Cherry Street connection and the Broadview Avenue connection. Although eventually there could be a link east via Commissioners from Cherry to Leslie Barns, that is in the distant future.

Slides 20: Riverside/Leslieville

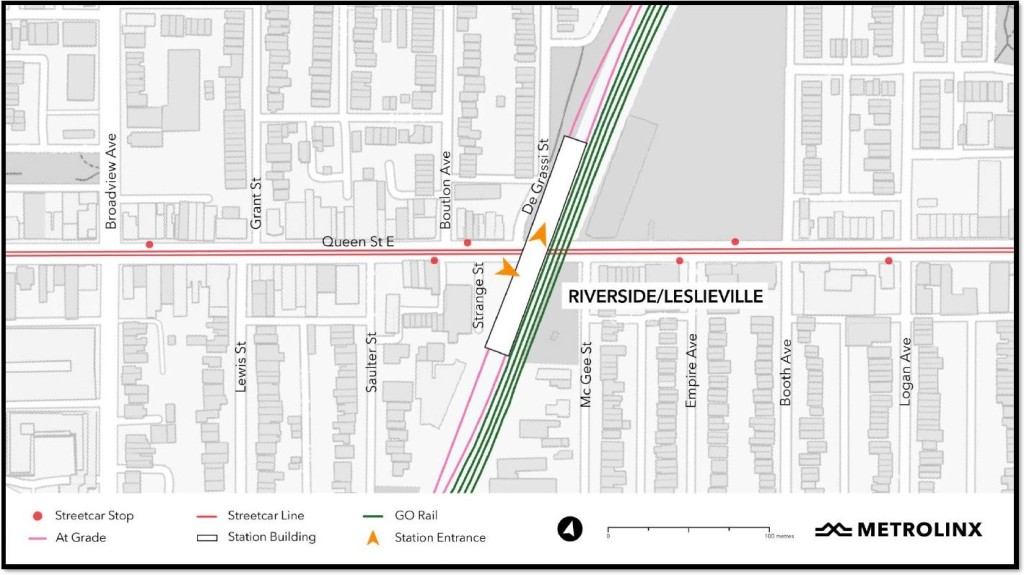
The station at Queen was misnamed “Leslieville” by Metrolinx, even though it is actually located in Riverside, a name that is over a century old. These stations are on the Joint GO/OL corridor and some of the design issues are complicated by shoe horning six tracks of transit into the available space.

No TOC development is proposed for Riverside Station, although it is self-evident that there will be development pressure nearby.

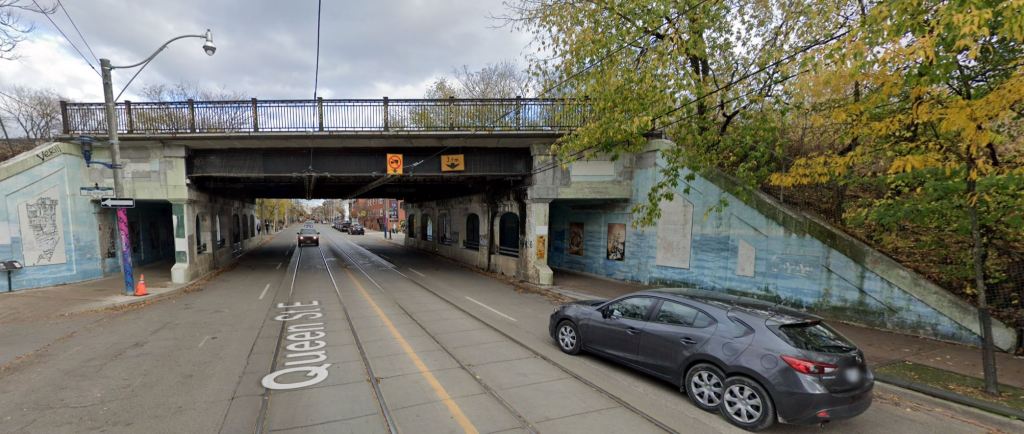
Slide 21: Joint Corridor

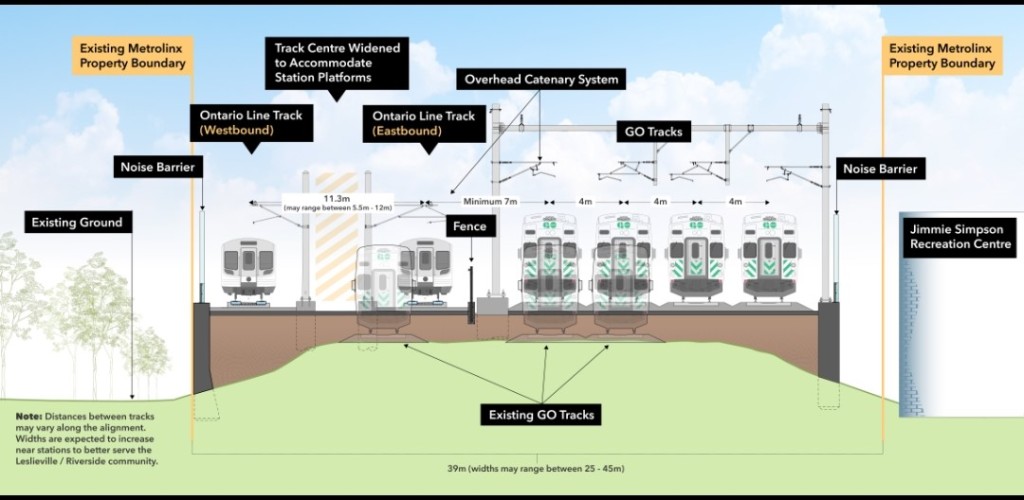
From East Harbour to Gerrard, the OL shares the existing GO corridor. There are now 3 tracks, but this will be expanded to 6 completely filling existing Metrolinx right-of-way.

  • The corridor will be raised by up to 1.5m with 4 new bridges that will provide 5m clearance for large vehicles.
  • Berm construction will be replaced by retaining walls.
  • All vegetation will be removed within the corridor and some adjacent lands due to clearance needed for electrification.

Metrolinx trumpets the expansion of parkland along the corridor. What they do not mention is that the percentage change in space is relatively small, and there is no guarantee that areas along the rail corridor berm that are now treed will be replaced in kind in the same location.

Full disclosure: I have worked with community groups in this area on a proposal for an alternative “hybrid” route using Metrolinx’ OL design west of East Harbour Station and the original RL design to the east and north. Metrolinx examined, but did not accept this design.

Slide 22: Gerrard


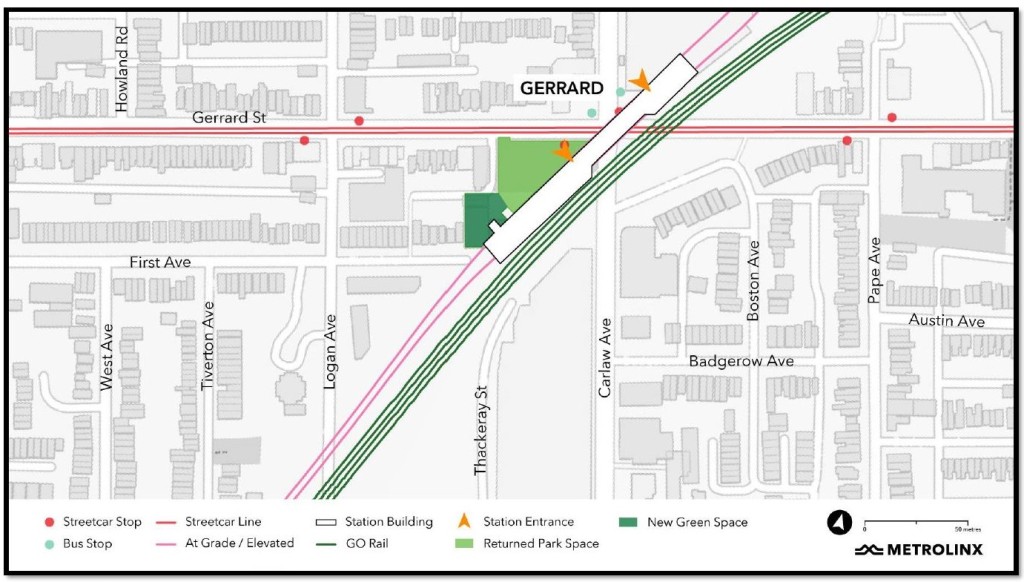
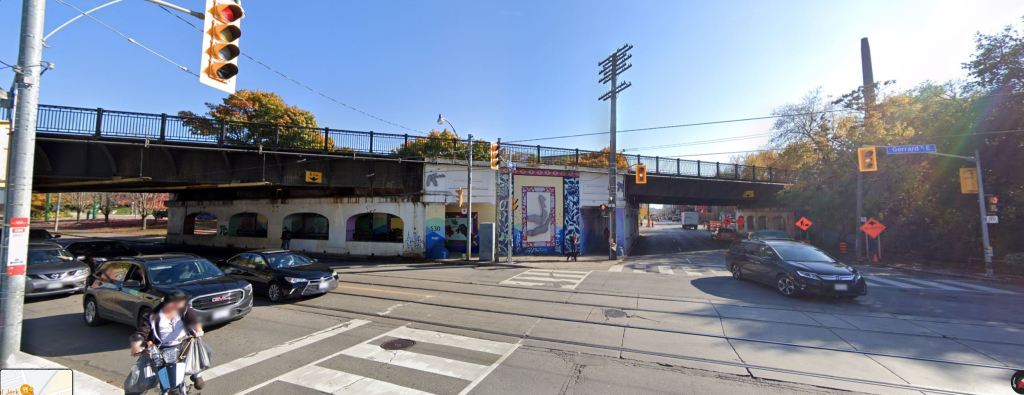
At Gerrard, there is a large commercial property at Gerrard Square east of the station. Again, it is not flagged as a TOC because this is not provincially owned, but it is an obvious location for intensification.

Northeast of Gerrard Station, the OL dives back underground for its trip north on Pape.

At one point, there was a proposal for a new GO/SmartTrack station here, but it would fit with the Ontario Line and has been dropped.

Slide 23: Northern Alignment & Danforth Pape

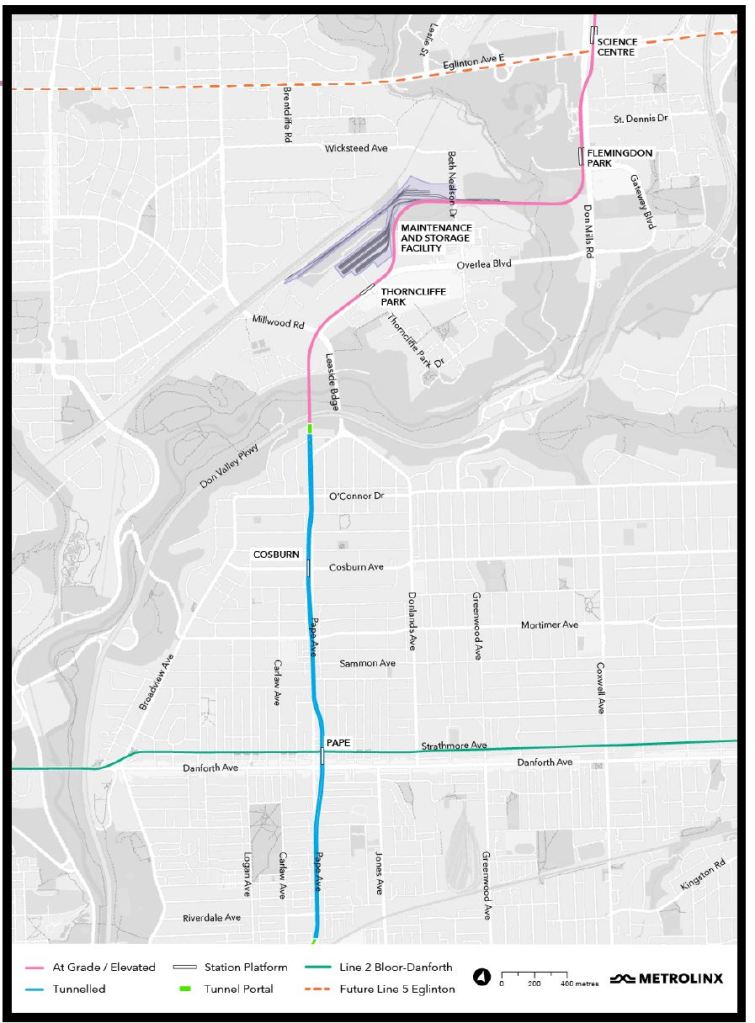
Much less detailed info available so far on this segment of the line. It comes north up Pape, dodges slightly to the east for the station at Danforth (a change from the original plan), and slightly to the west for the station at Cosburn (again a change from the original). There are no illustrations yet published by Metrolinx of how these stations will work, and especially how or if the interchange with the Danforth subway will make for easy transfers between the two lines.

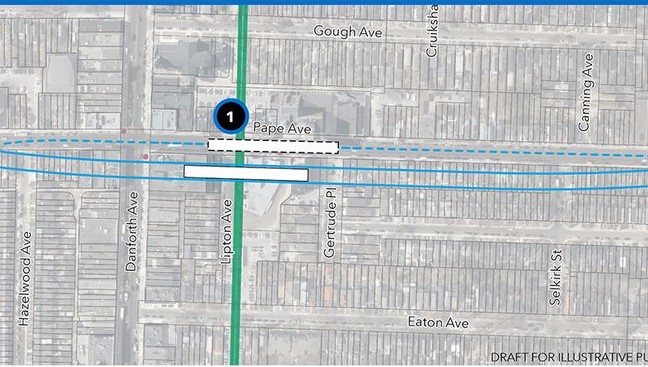
There is no TOC proposed for Pape/Danforth, but this has been flagged by City Planning for intensification as an MTSA.

Slide 24: Cosburn Station

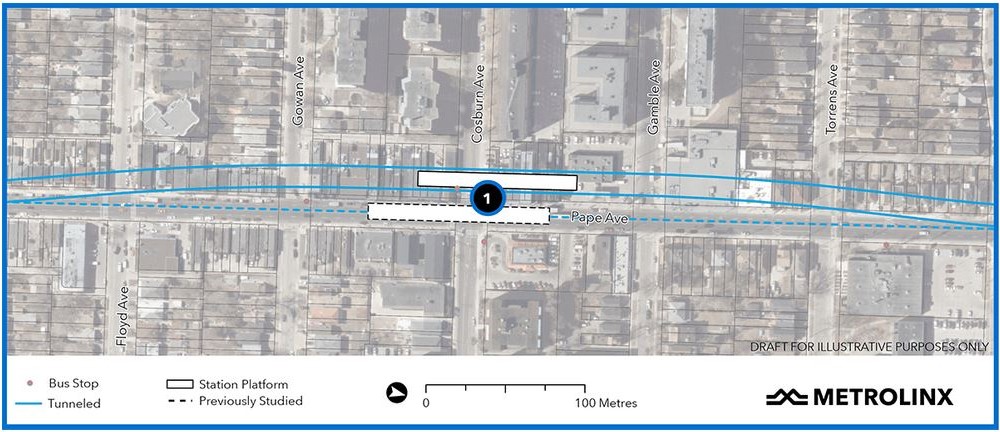
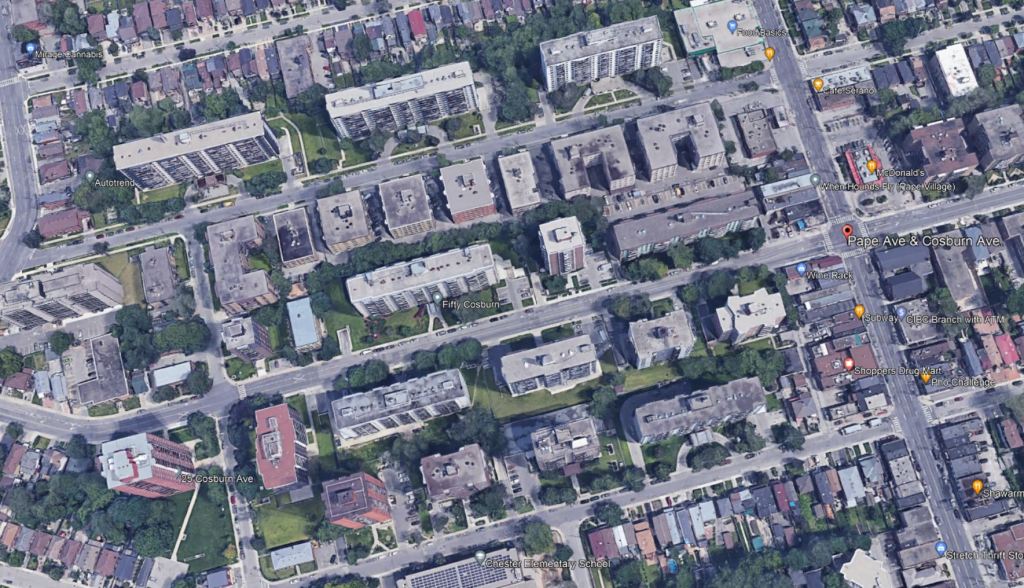
The station at Cosburn will be on the west side of Pape where there is now a collection of smaller commercial/residential buildings. The originally proposed location was under Pape Avenue.

West of the station to Broadview is a high rise apartment district. To the east is single family housing.

Slide 25: Minton Place / Don Valley Crossing

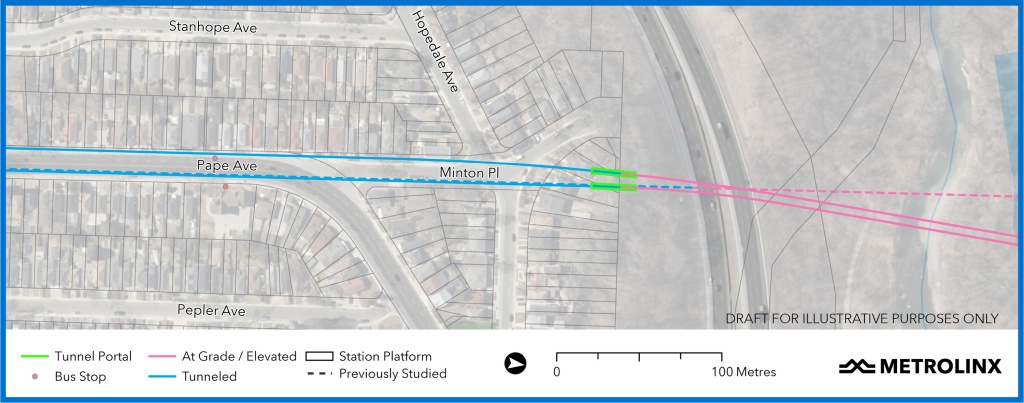
The OL runs straight north on the line of Pape via Minton Place. Four houses will be taken for the portal construction site (green above).

It will cross the Don Valley on a new bridge west of the existing Leaside bridge.

Note that a route following the road and using the existing bridge is not practical. There are structural issues with the bridge (it was not designed for a lower deck like the PEV, and added strength included originally for a streetcar line in the 1920s was used up when the bridge was widened to six lanes) and the curves approaching the bridge at both ends would be too tight.

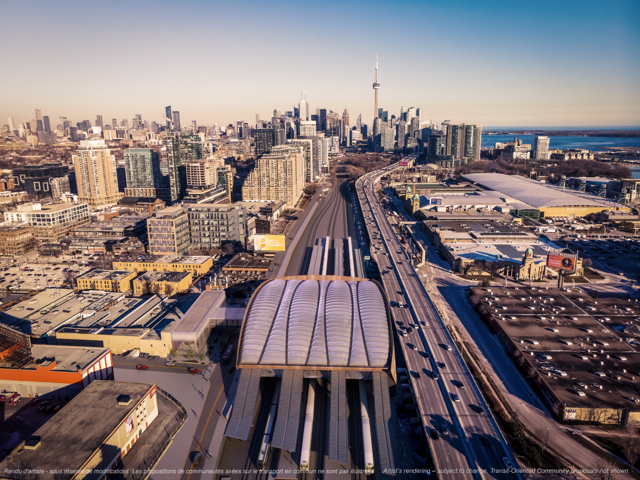
Slide 26: Thorncliffe Park / Overlea:

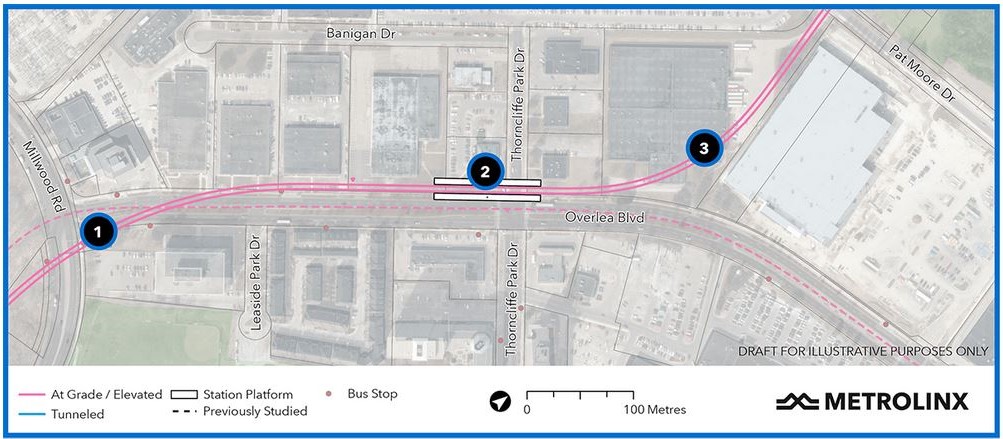
After crossing the valley, the OL turns east on an elevated structure on the north side of Overlea to Thorncliffe Park Drive West with a station on the northwest corner. The line then turns north to access a new maintenance yard south of the CPR tracks that divide Thorncliffe Park from Leaside. (The large building and parking lot on the right side of this image is Costco.)

The originally proposed alignment followed the middle of Overlea Boulevard and turned north at Don Mills Road.

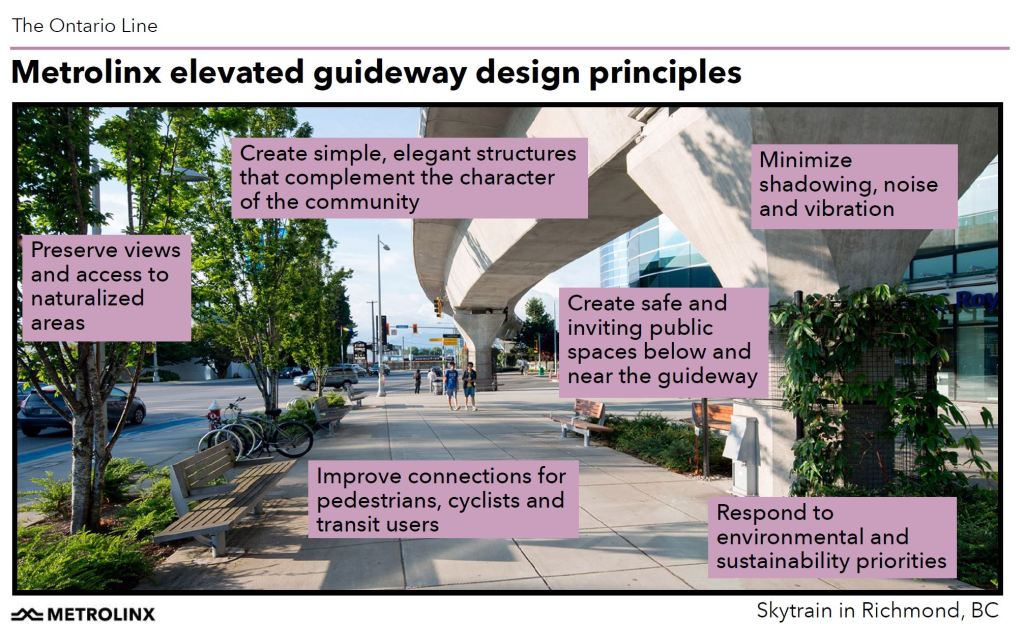
Metrolinx uses an illustration of the Vancouver Skytrain to show what the elevated structure will look like. This is not an entirely fair presentation because it does not include the space required for station platforms and vertical access from the street. It also does not show the specific relationship of the proposed structure with buildings that it will pass along its route and how open, or not, the space under the structure will feel.

Slide 27: Maintenance and Storage Facility (MSF)

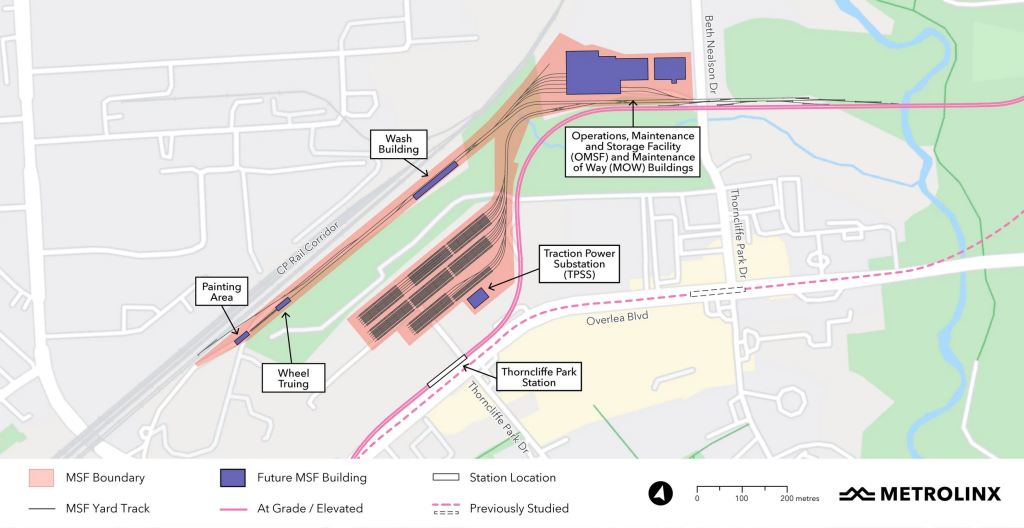
The proposed Maintenance and Storage Facility will be located at the north side of Thorncliffe Park on lands that are now occupied by a self-storage facility, a low-rise business park, and a mosque.

The MSF has two sections. At the north are the buildings where trains will be maintained, and to the south is the storage yard for trains. This is sized to support an eventual full build-out of service to its maximum capacity.

The mosque will relocate to land west of the proposed Thorncliffe Park Station and will be part of a community centre into which some of the existing businesses might also locate. It is not clear yet how well this has addressed business and community concerns, although Metrolinx speaks of the situation as effectively a done deal.

Among the community’s suggestions was to shift the yard portion of the MSF to the north side of the CPR corridor, but Metrolinx rejected this saying the site had already been rejected due to employment effects. They neglected to mention that only shifting the yard would not have required the entire site. (Full disclosure: I advised some members of the community on the viability of optional locations.)

Metrolinx community relations on this site were a textbook example of how to antagonize people about a project. If, instead of a secret plan for the MSF dropped on the community and businesses at the last moment, Metrolinx had truly engaged and worked through alternative plans up front, much of the contention might have been avoided.

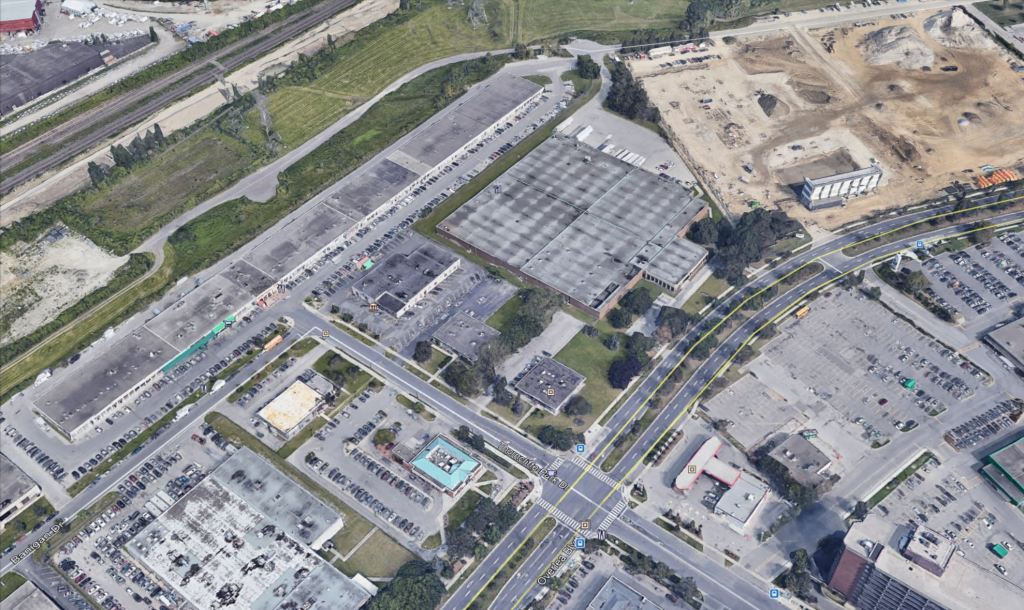
Slide 28: Flemingdon Park

Flemingdon Park Station is a “local” station for walk-out traffic from the neighbourhood to the east. A large part of this area will remain beyond easy walking distance, and a good transit link will remain essential especially for residents east of the DVP. They are more likely to be fed into Science Centre Station where there is a bus interchange.

An intriguing problem with redevelopment pressure faces the midrise areas of Flemingdon and Thorncliffe Parks. Will these areas remain affordable, or will they be replaced with larger form, expensive condos now that there is a subway station just down the street? The intensification goals of MTSAs and transit oriented communities could have unwanted consequences. A discussion of the potential effects, good and bad, of MTSAs is probably a webinar in its own right.

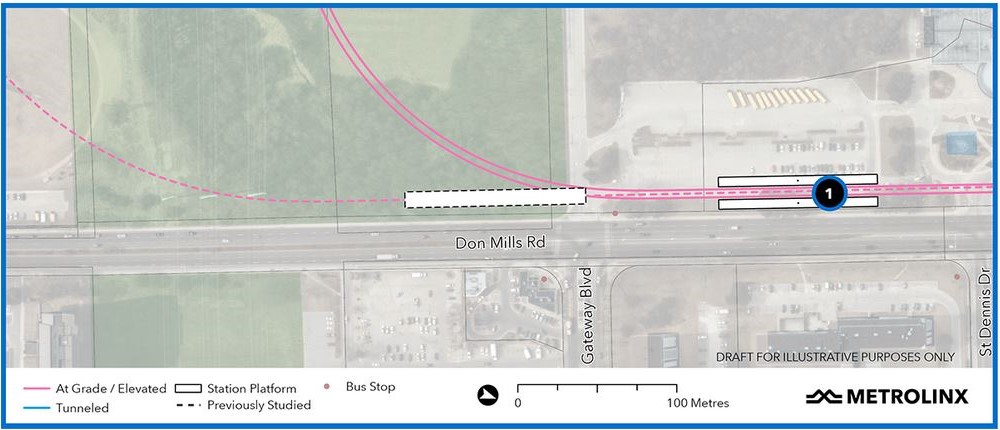
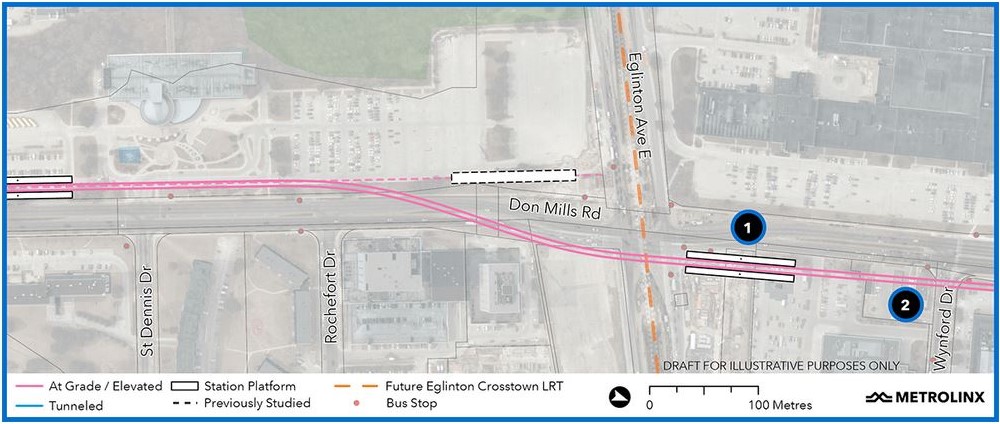
Slide 29: Science Centre Station

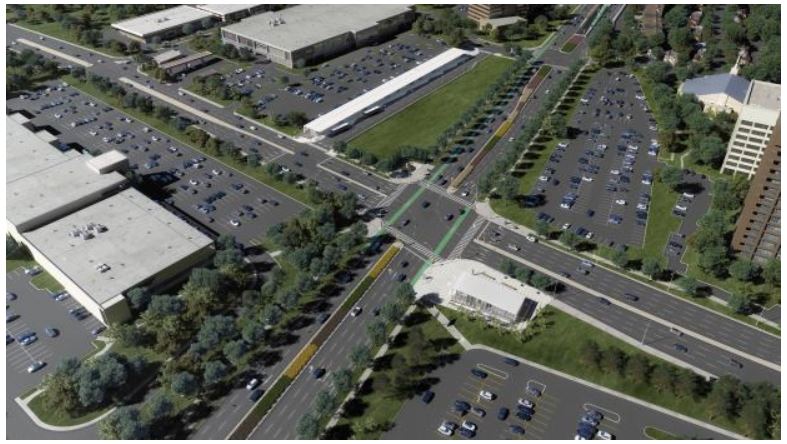
Science Centre Station already exists as part of Line 5 Crosstown which will open sometime in the coming year. There is a bus loop on the northeast corner. Transfers from the OL to buses will be simple, but to the Crosstown somewhat longer because of the relative location of the two stations.

Although the image shows no development here, large schemes are in the works. This is a “before” view that is already out of date.

The OL station was originally to be on the SW corner, but it has been relocated to the NE corner above the bus loop for a more convenient transfer. This also positions it for a northward extension as shown on the map.


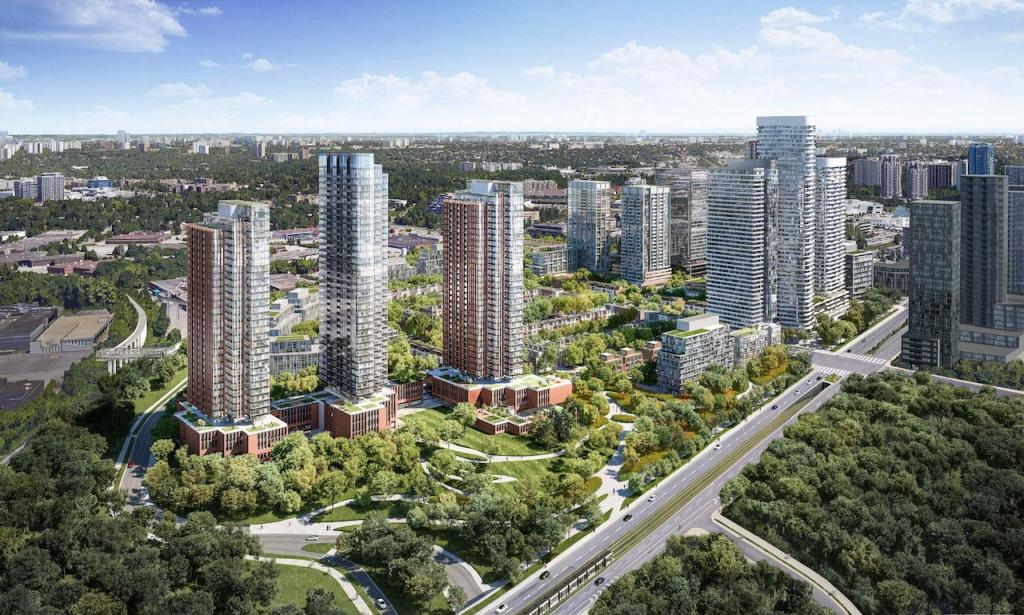
Slide 30: Science Centre Station Development

Updated February 2, 2022

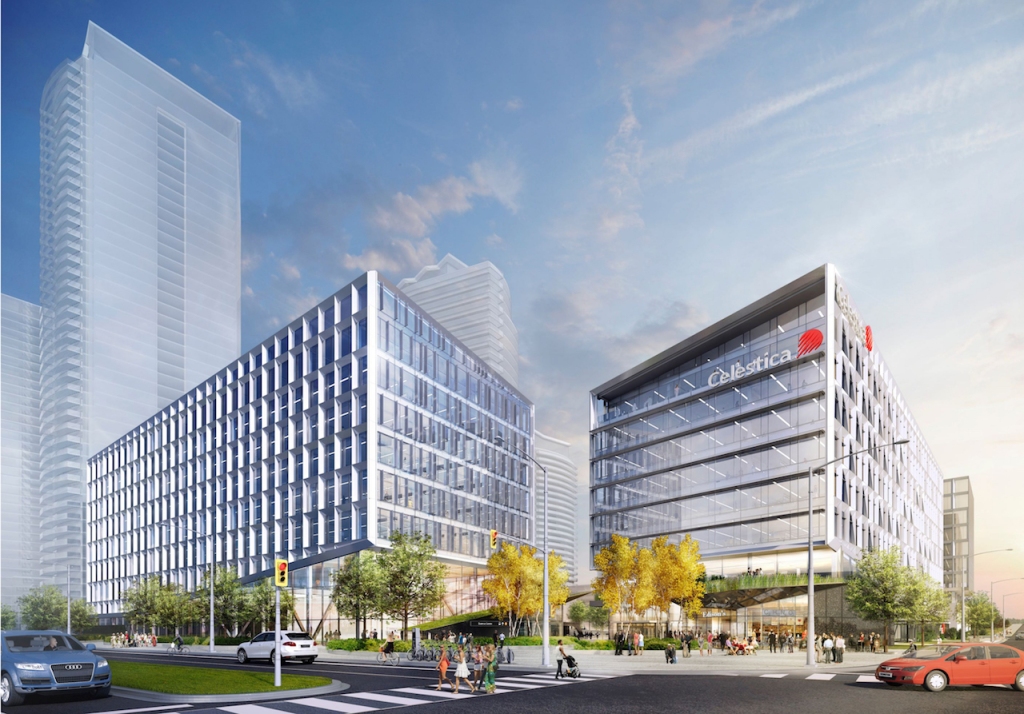
There is a 60.5 acre / 24.5 hectare development underway on the northwest corner, the former IBM/Celestica site. The other corners will not stay long as they are.

On the SW and SE corners, CreateTO plans a development including a new school. The view below looks southwest across the intersection. The Ontario Line guideway crosses Don Mills south of Eglinton to the station on the northeast corner (bottom centre).

That corner remains without a development proposal, but the land north of the station is a Superstore, and Loblaws/Choice REIT have been redeveloping their properties.
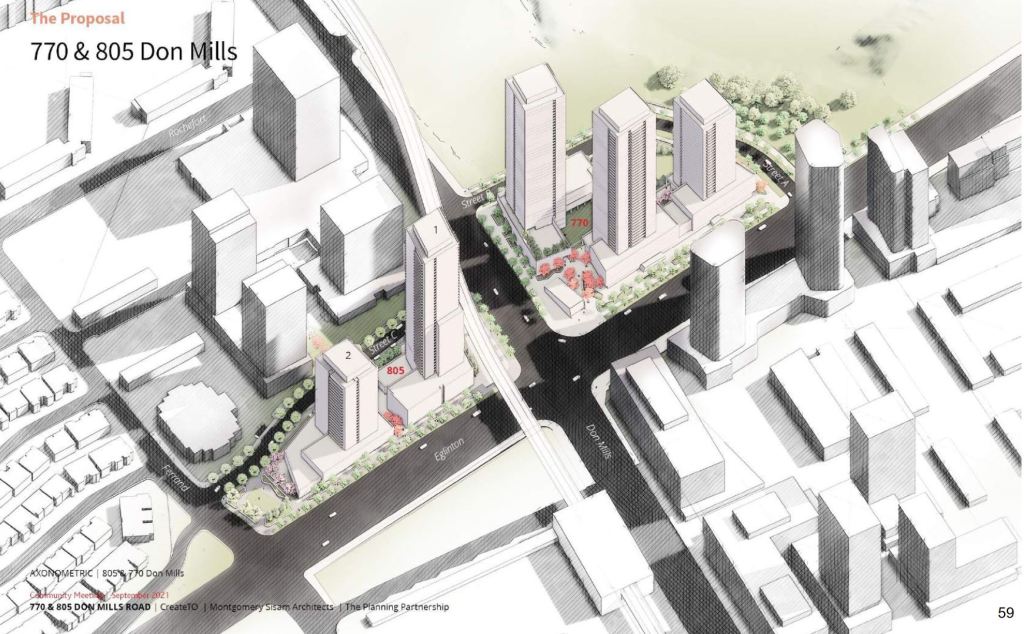
[End of update]

This station shows the limits of walking distances given the large existing and planned communities around it. Bus feeders will be vital to link areas around the intersection to this major transit junction.

Another important consideration here is the change in neighbourhood makeup the new rapid transit lines will bring.

Slide 31: Planning Issues

In a broader context than individual stations, there are a few issues I wanted to mention:

  • Just what “relief” does the Ontario Line provide?
  • A contrarian’s view of “Transit Oriented Communities”
  • Catchment areas and Liberty Village
  • Gentrification

Slide 32: Union Relief

The OL descended from the concept of subway relief, but it has developed an alternate justification: the relief of potential GO Transit overcrowding at Union Station. Metrolinx hopes to divert inbound riders onto the OL at East Harbour and Exhibition from GO.

Convenient transfer connections and an attractive fare structure are vital to making this work. Indeed, this idea drove the original straddle design with OL tracks on either side of the GO corridor for across-the-platform transfers. That would have limited GO trains to stopping only on the outside pair of tracks (in effect, only the “local” and not the “express” trains). The revised plan uses a concourse serving all tracks, and it turns out to be cheaper to build.

Metrolinx always talks of this diversion in terms of inbound riders, but has not addressed outbound travel. Boarding a GO train one station away from Union is analogous to boarding an outbound Bloor-Danforth train at Sherbourne or Bay when it is already filled with riders from Yonge Station.

This all begs the question of how much of the OL capacity will be consumed simply to act as a relief valve for a short distance either side of Union as opposed to its wider role in the transit network.

Slide 33: “Transit Oriented Communities”

I will take a contrarian view here and argue that simply placing dense development at rapid transit stations is not sufficient or even necessary to the success of a rapid transit line.

Two important factors affect demand.

(1) For locally originating trips, how easy is the walk to the station? Are there competing transit services or highways in the same general area? Does using the rapid transit line impose time penalties just to reach the station or to make a new transfer connection enroute?

(2) Trips can access a rapid transit station by feeder routes, and indeed it is no secret that the Danforth Subway was full in pre-pandemic times even though the built form along it is low rise. Where do these riders come from? Feeder bus routes especially on the outer end of the line.

Density does not equal demand unless the rapid transit line actually serves trips where people want to travel.

For GO Transit, this is relatively easy because they have (or had) a built in market wanting to get from their homes in the 905 to Toronto’s downtown. The railway network is ideally suited for that. However, travel to other parts of Toronto and the GTHA is much more challenging.

Rapid transit extensions have been less successful because their purpose was to generate development, no to react to a large existing demand. Only the proposed North Yonge extension to Richmond Hill lies in a long-established corridor. Demand has materialized much more slowly on the Spadina/Vaughan and Sheppard lines.

It is much harder to attract demand from residential clusters than to job-oriented rapid transit. One has a diverse pattern of origins and destinations that might lie of the transit grid, but equally well is probably better served by the highway network. The other concentrates demand at a node that suits a model of feeders into trunk routes.

The Ontario Line, to its credit, is not an extension of an existing line, but an entirely new addition to the network. As such it will provide many travel options in central Toronto that do not exist today, rather then simply shortening travel for riders in outer areas.

The Transit Oriented Communities component will see major development, mostly residential, around several stations.

Because the whole process of Metrolinx financing is shrouded in secrecy, there is no estimate of how much the transit line’s capital cost will be recouped from these developments, nor whether they will make any ongoing contribution to operating costs.

The province will use MZOs to implement the necessary permissions for these projects, and the City of Toronto has no control over them beyond moral suasion.

Slides 34/35: “Liberty Village” and Catchment Areas

This is a good point to talk about how a local rapid transit station is not the same as a GO station. Access is on foot or by feeder bus. The catchment area is defined by walking distance, local topography and available alternatives.

When we talk about “faster” journeys, this applies to an entire trip, not just to the OL component. If using OL requires a longer access, or extra transfers, riders may not turn up in droves.

A related problem is the planning lens that sees transit stations it terms of a 500-800m catchment area and the planning associated with MTSAs. This ignores the fine grained nature of older parts of the city and alternative transit services in the same area. We see this in several of the stations along the Ontario Line.

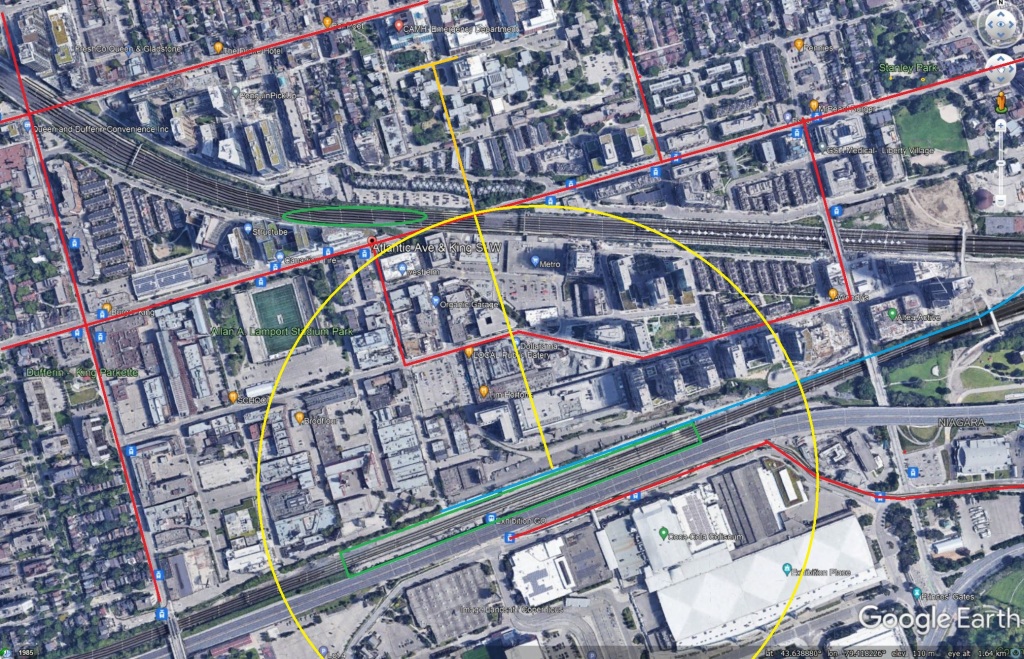
This map spans from the GO corridor at the south with Exhibition Station in the green box. The Ontario line in turquoise is immediately adjacent. TTC services (Harbourfront/Bathurst, King, Queen, Ossington, Dufferin) are shown in red. The green oval is at the future Liberty Village GO station on the Weston corridor.

The yellow circle marks a 500m radius from the station. The orange line extending further north shows the extent of an 800m radius, the “rapid transit” definition for an MTSA. Two issues are evident: (1) much of the developed area is outside of the 500m radius because the station is at the edge, not the centre of the development, (2) half of the circle lies south of the corridor where nobody lives. TTC services, and another GO station, will compete for riders.

Most other stations do not have the “half a circle” problem of geometry, but these circles do overlap as shown on the graphic for this webinar at the top of the article. This is rarely a problem for commuter rail stations, but planning for them and for local transit are two quite different matters.

Slide 36: Gentrification

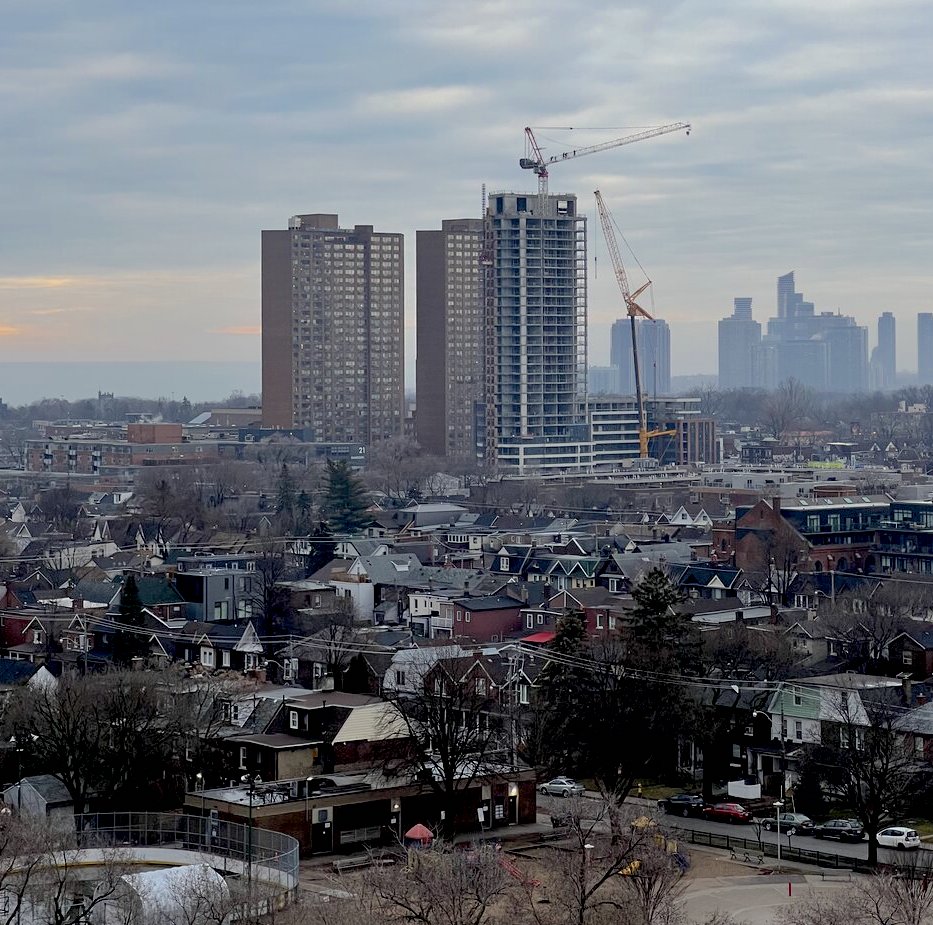
A side effect of rapid transit construction and the provincial mandate for greater development density near transit stations is that many existing neighbourhoods will be targets for new development. A particular example is the western part of Flemingdon Park.

Unlike Liberty Village which was an old, underused industrial district, Flemingdon Park is a large, existing residential neighbourhood.

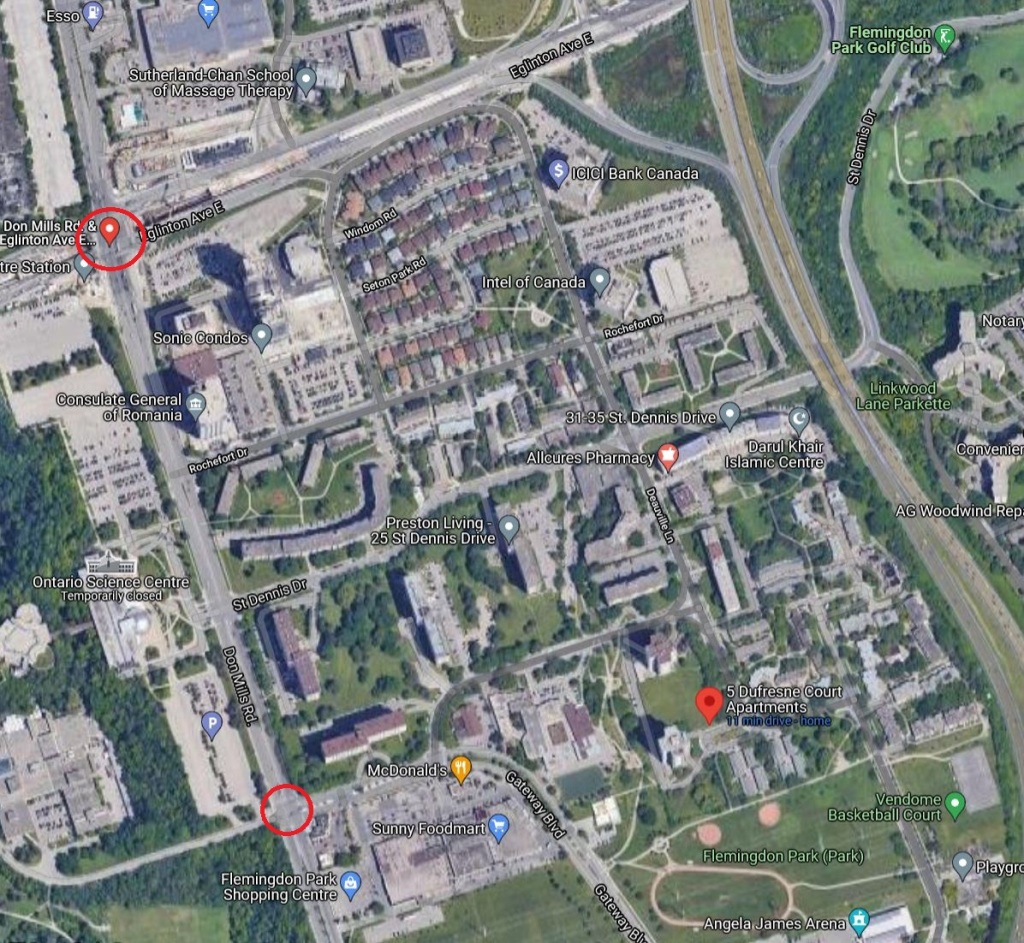
The photo shows the area between Don Mills and the DVP from Eglinton south to the Hydro corridor. Two thirds of this (the portion to Deauville Lane) is within 500m of either Science Centre and Flemingdon Park Stations (red circles). If we expand the reach to 800m, everything to the DVP is included.

Many of the buildings here are low-rise rentals, and already there are condo development proposals that will affect these units.

Gentrification of areas around transit stations will be a pervasive part of our transit plans in coming decades, but this will do little for the cause of affordable housing and could, in some cases, worsen the situation.


Would you move further out of the city to secure the type of home you’re looking for within budget?

Given how popular work from home has been in the last few years, the option to choose home type first and city second is opening up to more buyers in Southern Ontario.

In fact, a Zoocasa survey early last year found that the pandemic has led to 32% of Ontario buyers purchasing a property in a location further than what they would have previously considered – and given the consistent price increases recorded across the province throughout 2021, it’s safe to say that trend has continued.

Buyers who have their eye on a certain type of home, whether that’s a condo in the city centre or a townhome with a yard for their dog, can save big if they can be flexible on which city in the Toronto Region they’d like to make their purchase in.

To help prospective buyers narrow down which areas they should consider focusing their house search in, Zoocasa has ranked the top five most affordable cities within the bounds of the Toronto Regional Real Estate Board to buy a detached home, semi, condo townhouse, and condo apartment based on November 2021 sales data*.

In other words, if finding the right type of home at the right price point is more important to you than buying in any particular city, this report is designed to help you discover which cities to consider in your home search.

Brock is the Most Affordable Place to Purchase a Detached Home


Although the average price for a detached home in the Toronto Region hit $1,567,832 near the end of last year the top five most affordable cities to buy a detached home in the greater region all clock in with an average price under a million dollars – a significant savings of more than $500,000.

Brock, the most affordable city on the list, is a small town in the north end of Durham township. As of 2016, the population reached just over 11,000 – making it a great choice for buyers looking for more space and a small-town lifestyle.

With an average price of $774,500, detached homes here are half the price of the region’s average. However, affordability comes with a proximity tradeoff. Brock is located in the Toronto Region’s farthest north reaches, and nearly borders Lake Simcoe. In good traffic conditions, you can reach Union Station by car in a little over an hour and a quarter, but Barrie and Peterborough are both closer cities – meaning you likely won’t want to commit to a daily, downtown Toronto commute if you’re living here.

If you’re looking to live a little closer to Toronto’s core, Oshawa and Orangeville both offer better connectivity to the rest of the GTA, with detached homes still coming in at an average price of less than a million. If you’re looking for small-town living, Essa (near Barrie) and Scugog (near Port Perry) are other options on the list that round out our top 5 most affordable places to buy a detached home in the Region.

Orangeville is Also the Most Affordable Place to Buy a Condo Townhouse

If things like multiple floors of living space and access to private outdoor space are high on your wishlist, a condo townhouse might be an affordable option for you to consider. Combining the higher-density building form and ownership structure of a condo, these homes are a great blend of space and affordability, especially for young families.

Regardless of your desired city, the average price in the Toronto Region is $826,475 for a condo townhome, which is well below the average price of all home types. When looking for the most affordable cities to choose from, Orangeville comes out on top again with an average price of $570,625 for this type of home.

The rest of our more affordable options come from Durham Region, with the cities of Oshawa, Whitby, Clarington, and Pickering rounding out the remaining spots on the list.

Oshawa is the Most Affordable Place to Buy a Condo Apartment

Condo apartments are one of the most affordable home types on the market in the Toronto Region today, with the average price as of November hitting $711,933 – a rate that comes in at over half the cost of the average detached home.

Within this category, you can find options with average prices under $400,000 if you consider moving to Oshawa, where the average price for a condo apartment was just $381,795 near the end of 2021.

Compared to some of the other cities that topped our list of affordability, Oshawa is considerably larger and more connected. With a population of 170,071 you’ll find more big-city amenities than what’s offered in Orangeville and Brock.

When it comes to your commute, you can make it downtown in 45 minutes by car in good traffic conditions, and taking public transit to work is a viable option with frequent GO Train service.

Other cities that top the list for the most affordable places to buy a condo apartment in the Toronto Region include Orangeville, New Tecumseth, Brampton, and Newmarket

What Do Buyers Need To Know About Moving Further Away From The City Centre?

According to Zoocasa Sales Representative, Allyson Neves, many of today’s buyers understand that being flexible on the location of their home purchase can help them check more boxes off of their wishlist

“Lately when I’m working with buyers, they’re coming to me with their top budget and wishlist for their home then asking me where they’ll need to move to marry the two. It becomes my job to help introduce them to new neighbourhoods or smaller towns that they may not have considered previously” she explains.

When working with buyers with this mindset, Neves starts the process off by understanding the non-negotiables. “It really comes down to knowing your price point first, along with anything else that binds you to a certain general location.”

“Usually buyers will come to me with a general bound for their location. This used to commonly be ‘no more than an hour from the office’. However, with work from home or hybrid options becoming the norm in many industries, I’m more often hearing ‘no more than an hour from my family’, or ‘I’d like to stay north of Toronto’. I compare this request with their budget and talk about which areas would be a fit for what they’re looking for in a property. From there, we start our house hunt. If you’re a buyer with this mindset, it’s helpful to work with an agent who really knows the general area you’d like to purchase in, they’ll be able to introduce you to some of the best places to consider during your search.”

While this report focused on the most affordable locations to purchase in the GTA outside of the city centre, this same mindset can still be applied for buyers looking outside of Toronto too. Neves, who is based out of Barrie explains, “as an agent that specializes outside of the GTA, it’s been a real pleasure introducing buyers who are new to the area to all that outside-of-Toronto living has to offer. Many are excited to trade city living for more space.”

Who doesn’t love a good map? Maps are so much more than just a nice-looking view of an area. They can be highly useful as a way to effectively display data about an area in a way that is immediately readable. In real estate, maps are crucial for all sorts of tasks like title searches, zoning, land surveys, and more.

In a city like Toronto, there is so much different variety between areas and one of the best ways to view these differences is through mapping. For investors, these maps present a quick and easy way to learn about areas in the city and compare them to one another. For example, if you are looking at an area to buy in, these maps could give you a better idea of the nearby area in detail and in less time than going for a walk around on the street. Let’s take a look!

Neighbourhoods map

This map gives you an idea of the many different neighbourhoods in Toronto today. From downtown Toronto to the edges of the city, each of Toronto’s 140 neighbourhoods has its own unique history and community. Learn more about each of Toronto’s neighbourhoods on the city’s website, or read our list of top neighbourhoods here.

Toronto city zoning map

This detailed map shows the various different zones in the city of Toronto. It can be pretty surprising to see just how much of the city mixes commercial, residential, industrial, and open space, and how some areas are distinctly reserved for one or two zoning types.

Crime maps

You might be wondering what crime has to do with real estate? Well, if you are looking to invest in a property, especially if you plan on renting out that property, crime rates can affect how desirable the neighbourhood is, and therefore how your investment may perform and how much rent you can collect. The Toronto police provide multiple interactive maps to keep you informed on where certain crimes are statistically more common and which areas are the safest of all.

Toronto transit maps

One of the biggest considerations for people looking to rent in the city is how they are going to get around. For many, public transit is the way they get around every day and is well connected to the rest of the city can save time and headaches. This Toronto map shows all the different subway, streetcar, and bus routes in the city. It’s amazing how connected we are!

Parks and trails

If you are looking to escape from the concrete and noise of the city, there are many public parks and trails that residents can enjoy – more than you might expect. The trick is in finding these areas. This handy map can help you find some greenspaces near you for when you need to get away close to home.

And many more

On the city of Toronto maps page and the open data directory, you can find many more maps for everything from tourist attractions to outdoor ice rinks (see above). This site is definitely a must-see for a map-loving Torontonian – though some maps may be more useful than others.

The January 2022 Market Update affirms Ontario’s historic commitment to modernizing the province’s public assets, including hospitals, highways, public transit, children’s treatment centres, courthouses and correctional facilities.

IO’s first Market Update for 2022 includes 39 projects, with 24 projects in pre-procurement and 15 in active procurement, totalling an estimated $60 billion in contract value.

The list also includes 14 additional government-announced projects in early stages of planning and determining the project’s scope, timing and delivery model.

IO continues ongoing productive discussions with the industry as we move forward on this large portfolio of projects and we are pleased to provide the latest information on changes in the procurement status of our projects.

Market Update – January 2022

A new year brings a new set of tax numbers, and here are the important figures you need to know for 2022.

Each year, most (but not all) income tax and benefit amounts are indexed to inflation. The Canada Revenue Agency in November 2021 announced the inflation rate used to index the 2022 tax brackets and amounts would be 2.4 per cent. This rate was calculated by taking the percentage change in the average monthly consumer price index data as reported by Statistics Canada for the 12-month period ended Sept. 30, 2021, relative to the average CPI for the 12-month period ended on Sept. 30, 2020.

Increases to the tax bracket thresholds and various amounts relating to non-refundable credits took effect on Jan. 1, 2022. Increases in amounts for certain benefits, such as the GST/HST credit and Canada Child Benefit, however, only take effect on July 1, 2022. This coincides with the beginning of the program year for these benefit payments, which are income tested and based on your prior year’s net income, to be reported on your 2021 tax return due this spring.

Tax brackets for 2022
All five federal income tax brackets for 2022 have been indexed to inflation using the 2.4-per-cent rate. The 2022 federal brackets are: zero to $50,197 of income (15 per cent); more than $50,197 to $100,392 (20.5 per cent); above $100,392 to $155,625 (26 per cent); over $155,625 to $221,708 (29 per cent); and anything above that is taxed at 33 per cent. Each province also has its own set of provincial tax brackets, most of which have also been indexed to inflation, but using their respective provincial indexation factors.

Basic personal amount (BPA)
This is the amount of income an individual can earn without paying any federal tax. You may recall the government in December 2019 announced an increase of the BPA annually until it reaches $15,000 in 2023, after which it will be indexed to inflation.

For 2022, the increased BPA has been set by legislation at $14,398, meaning an individual can earn up to this amount in 2022 before paying any federal income tax. The value of this federal credit for taxpayers earning more than this amount is calculated by applying the lowest federal personal income tax rate (15 per cent) to the BPA, making it worth $2,160. (Because the credit is “non-refundable,” it’s only worth the maximum amount if you otherwise would have paid that much tax in the year.)

But higher-income earners may not get the full, increased BPA since there is an income test. The enhanced BPA is gradually reduced on a straight-line basis for taxpayers with net incomes of more than $155,625 (the bottom of the fourth tax bracket for 2022) until it has been fully phased out once a taxpayer’s income is over $221,708 (the threshold for the top tax bracket in 2022). Taxpayers in the top bracket will still get the “old” BPA, indexed to inflation, which is $12,719 for 2022.

Government pension contributions
The Canada Pension Plan (CPP) rate for 2022 is 5.7 per cent (the Québec Pension Plan (QPP) rate is 6.15 per cent) with maximum contributions by employees and employers set at $3,499.80 ($3,766.10 for QPP) in 2022, based on the new yearly maximum pensionable earnings of $64,900 (with a $3,500 basic exemption.) Self-employed Canadians must contribute twice the amount, so their maximum CPP contribution for 2022 will be $6,999.60 ($7,552.20 for QPP), up from the 2021 amount of $6,332.90 ($6,855.80 for QPP).

The CPP hike is part of a multi-year plan approved by the provinces and the federal government five years ago to increase contributions and benefits over time.

EI premiums
Employment insurance premiums are also rising, with a contribution rate for employees of 1.58 per cent (1.2 per cent in Quebec) up to a maximum contribution of $952.74 ($723.60 in Quebec) on 2022 maximum insurable earnings of $60,300.

TFSA limit
The 2022 tax-free savings account (TFSA) contribution limit will remain at $6,000 for the fourth year in a row. That’s because the government in 2015 announced that, starting in 2016, the annual TFSA limit would be fixed at $5,000, indexed to inflation for each year after 2009, but rounded to the nearest $500. In other words, once the cumulative indexed annual TFSA contribution limit hits $6,250, it will jump to $6,500.

For 2022, that indexed contribution amount is $6,162.70, based on the 2.4-per-cent inflation factor above. But the limit for 2023 is expected to increase to $6,500, provided the 2023 indexation adjustment is at least 1.5 per cent.

The cumulative TFSA limit is now $81,500 for someone who has never contributed to a TFSA and has been a resident of Canada and at least 18 years of age since 2009.

RRSP dollar limit
The registered retirement savings plan (RRSP) dollar limit for 2022 is $29,210, up from $27,830 in 2021. Of course, the amount you can contribute to your RRSP is limited to 18 per cent of your 2021 earned income, which includes (self)employment and rental income, less any pension adjustments, up to the current annual dollar limit.

OAS
If you receive Old Age Security (OAS), the OAS repayment threshold is set at $81,761 for 2022, meaning your OAS will be reduced in 2022 if your taxable income is more than this amount, and is fully eliminated with taxable income over $133,141.

Working from home
Finally, a reminder that those of us who continue(d) to work from home in 2021 and 2022 will once again be able to take advantage of the temporary flat rate method, introduced for the 2020 tax year, to calculate home office expense deductions.

Under the temporary flat rate method, employees can simply claim $2 for each day they worked from home due to the pandemic. The government in December announced in its economic statement that it was increasing the maximum claim to $500 (from $400) for the 2021 and 2022 tax years.

For Maclean’s eighth annual chartstravaganza, we’ve once again asked dozens of economists and analysts to ponder the year to come, and choose one chart that will help shape Canada’s economy in 2022 and beyond, and explain this outlook in their own words.

This year, we’ve decided to release the charts over several days, making this more of a Chart Week than a one-day data binge. We also cover jobs and income, inflation, COVID, and energy.

How we’ll weather higher interest rates

Canadian households and housing markets can weather the interest rate increases the Bank of Canada is widely expected to deliver next year. At present, fewer than half of Canadian households have mortgages or home-equity lines of credit (HELOCs). About 75 per cent of existing mortgages are locked in at fixed rates, while the much smaller stock of HELOC balances carries floating rates. Scotiabank Economics expects holders of the most popular five-year term mortgages that renew in 2022 to see their rates increase by an average of 36 basis points (bps), which translates into about $50 a month in additional payments on the current average outstanding loan balance of $241K. Renewals in 2023 are forecast to see rate increases of about 45 bps, or around $65, in additional monthly payments. While no one wants to pay more on their mortgage, Canadian borrowers are set to absorb higher rates: under federally mandated stress tests, they had to show that they could cope with rates around 180 bps higher when they contracted mortgages nearly five years ago on larger principals.

New mortgages taken out during 2021 have been stress-tested against an even tougher standard: borrowers have had to show they could handle a 5.25 per cent interest rate, about 250 bps over five-year fixed rates and some 380 bps over variable rates on offer in December 2021. Although the share of variable-rate mortgages in new originations soared in 2021, they still account for only about one-quarter of all mortgage balances outstanding. Under most variable-rate terms, rising rates don’t trigger immediate increases in monthly payments; instead, amortizations are lengthened. Where higher interest rates do mean larger current debt-servicing costs, mortgages can generally be converted into fixed-rate loans.

Canadians are ready for a return to normal interest rates.

Inflation is behind home price growth—way behind

Canada’s housing bubble has grown into a massive problem for the Canadian financial system. House prices are much higher here than in most other countries, and levels of household debt incurred to keep up with the bubble are now a major risk.

One of the less well-known aspects of the bubble is its lack of upward pressure on inflation and the consumer price index, even as house prices have soared.

This chart shows that house prices in Toronto, Vancouver and nationally have grown about 4.25 to almost five times, with household debt keeping pace. That rate of increase is above seven per cent per year. Yet, the CPI measurement of housing costs known as “shelter” (shown in green with the arrow) has only inched ahead, growing by about 1.6 times. Most of the time that growth has been less than two per cent per year.

You might ask how this happened, especially since “shelter” is the largest weight component of CPI. Statistics Canada uses a monthly payments approach to measuring housing costs. The cost of buying a home is not included. A key part of the monthly cost of housing for owned accommodation is the mortgage payment, comprising principal repayment and interest. And interest rates have declined steadily over the last two decades, keeping the house-price bubble alive but holding the cost of shelter to a smaller gain.

The irony is that as the Bank of Canada increases interest rates, starting next year, house prices might drop, yet the CPI measurement of housing costs will grow, as the rate of interest is a significant weight in the calculation.

Housing construction will simmer down in 2021; will business step up?

Amid the many staggering economic statistics that emerged from the pandemic, this may be the most staggering: in the first three quarters of 2021, residential construction accounted for a larger share of Canadian GDP than did business investment. That has never happened before, not even close. In the 50 years prior to the pandemic, business investment was typically about twice as large a share of the economy as housing—a “normal” year would see about 12 per cent devoted to private capital spending and six per cent to residential construction. (Statistics Canada includes new homebuilding, renovation activity and real estate agent fees in the latter.)

The crossover in 2021 speaks to both (a) very weak business investment (tied with 1993 as the lowest on record), and (b) very strong housing activity (a record high share). Because all of these figures are stated in current or nominal terms, sizzling home prices played a role in the ballooning housing activity. But even in real or inflation-adjusted terms, housing’s share of activity would still rival the late 1980s for the strongest on record.

Looking ahead, housing is expected to simmer down from the 2021 extremes, and it was already easing from the early-year fireworks. The bigger question mark for the Canadian economy is whether business investment can now step up—we suspect it will, but look for only a moderate near-term recovery. Canada’s heavy dependence on housing doesn’t look to end anytime soon.

Stoking the home shopping spree

There has been a lot of focus on a lack of housing inventory, but little focus on the real issue—excess demand. When the Bank of Canada (BoC) cuts rates and uses quantitative easing, they’re looking to stimulate demand to raise inflation. The mechanism of lowering rates pulls consumers forward, to compete with existing buyers. Higher competition for the same lot of goods means more inflation.

That’s what’s happening with real estate. From April 2020 to October 2021, Canada saw about 246,500 excess home sales above the trend. In contrast, new listings came in higher, but just 85,800 homes above trend—far lower than the boost in home sales.

Separately, BMO estimates the annualized dollar value of excess home sales to be around $150 billion. It’s about the equivalent of six per cent of Canada’s GDP. That’s not total sales, it’s just the excess above the trend, stimulated by cheap credit. Keep in mind, this is happening with virtually no population growth.

The BoC stimulated demand to raise home sales and inflation, and now pretends it has no idea where it came from. Golly gee whiz, what a mystery.

Single-family homes are becoming precious commodities

The number of single-family homes listed for sale in major metropolitan areas across the country has fallen precipitously in recent years. In the Greater Toronto Area, listings have fallen 52 per cent compared to last year and are down a stunning 77 per cent from 2017 levels. In Vancouver, it’s a similar story, with inventory down by nearly one-third compared to last year and by over half since 2018.

While excess demand and speculation are no doubt contributing factors to this decline, the main driver appears to be a shortfall in new construction in the past decade at a time when population growth was exceptionally strong. From the 1970s until the 2000s, population growth averaged about 3.1 million per decade while new single-family completions averaged just under 1.3 million. But in the 10 years from 2010 to 2019, population growth surged to four million, while new completions fell to less than 1.1 million.

Until Canada figures out how to right this imbalance, we can expect single-family homes to be coveted assets in major markets across the country.

The Greater Toronto Area is one of the hottest regions in the Canadian housing market and has been for a long time. With so much attention from buyers and investors, the ever-pressing question is how the market will perform in the coming months and years.

Despite difficulties stemming from pandemic conditions in the past two years, price growth has stayed strong in the GTA, continuing its decades-long climb. Can we expect a continued fast pace of growth in house prices, or will things slow down? Will we see a large price correction in the coming years?

In this article, we will explore some of these questions and get a better idea of what the future may hold.

The current state of the GTA housing market
It should be no surprise to anyone paying attention that the housing market in the GTA is growing at a rapid pace. For over a year now, markets in the GTA have continuously reported record-breaking months and record-high house prices. At the same time, housing stock in the GTA has hit dismal lows. Today, the GTA is one of the most expensive of all Canadian housing markets.

Average prices in the GTA
In November of 2021, the average price across the GTA rose to $1,163,323, up from $955,889 at the same time last year. In terms of market activity, the region recorded over 9,000 home sales and only 10,036 new listings.

In this month, the price of single detached homes edged above $1.5 million, a 30% increase year over year. The semi-detached and condo segments saw average prices of $1,206,016 and $715,104 respectively. That means condos now in the GTA cost around the same that an average single-detached home did in 2014.

With sales up since this time last year but listings down, the GTA has remained firmly within seller’s market territory and the Toronto Regional Real Estate Board (TRREB) is calling attention to “an inherent supply issue across all home types in the Greater Toronto Area.”

Though home price appreciation continues in the GTA, price acceleration has begun to slow, indicating a cooling off from rapid price gains of mid-2020.

What might the future hold?
As indicated by the statistics above, there are a few things that are driving the real estate market in the GTA. Firstly, the area has a lot of economic momentum. Not only is it Canada’s most populated region, but it’s also a hot spot for industry, business, and jobs. It sees huge amounts of yearly investment from both domestic and international sources, as well as steady population growth.

This can to some extent explain the high levels of housing demand in the GTA housing market. Simply put, people want to be where the action is. This is coupled with the fact that supply is so low in the city. In the past years, active supply in the market has dwindled, with homes being bought up about as fast as they can be put on the market, contributing to tight market conditions.

Demand can be reduced in a few ways. One major way would be to push buyers away from the housing market, while another would be to actually satisfy demand with a proportionate amount of housing supply. Unfortunately, even with large increases in housing seen in the GTA in the last year, it is unlikely to make enough of a dent to significantly impact housing affordability.

In terms of reducing demand, there is hope that an increase in interest rates could ease demand and slow price acceleration. In addition, upcoming regulations such as limiting foreign purchases and a vacancy tax are intended to help reduce demand as well. However, the actual effectiveness of these changes is contentious and remains to be seen.

With the forecasted end of pandemic conditions in 2022, other factors may keep demand high in the GTA, such as many people returning to work in the city, returning post-secondary students and increased immigration.

With more population growth and increasingly unfavourable detached homes, the condo segment, which has seen relatively slower increases in price, may see sales and values continue strong in the coming years.

Overall, opinions are mixed among economists and real estate professionals on what the future holds for the GTA and for Canada’s housing market. In general, it seems the market will continue strong or steady through 2022, with the potential for a small price correction. Though given the recent increases in home prices, even a significant correction would only see prices return to the still high values of a few years prior.

In its recent Housing Market Outlook report, the Canada Mortgage and Housing Corporation predicted continued price growth through to 2023, though at slower rates than seen recently.

Buying or selling in the GTA today
In terms of buying, many are trying to get in now before an impending increase in interest rates makes large mortgages moderately less affordable. If you are waiting for lower prices before buying, however, you may be out of luck.

For sellers, you can be assured your house will sell easily, and for a good amount of money if you choose to list it. But should you? With property in the GTA being so hard to come by, and its years-long trend in appreciation, values in the market will likely remain strong for at least a few years to come. However, if you want to move your money elsewhere or buy in another city, you will find your money will go much further in other areas with better affordability.

It’s predicted that Canada’s home prices could soar next year thanks in part to pent-up demand and the median cost of a single-family house could reach more than $900,000.

According to the new Royal LePage Market Survey Forecast released on December 15, home values in Canada are expected to “rise strongly” in 2022 but at a slower pace compared to 2021.

The aggregate price of a home in Canada is set to go up 10.5% year-over-year to $859,700 next year.

Also, the median price of a single-family detached house is projected to increase 11% to $918,000 while the cost of a condo is predicted to rise by 8% to $594,000.

Royal LePage has cited pent-up demand from people who weren’t able to buy a home in 2021 along with the “growing need” for more properties as the reasons for the increases.

It said that these factors put upward price pressure on the market that’s already dealing with a supply shortage.

Locally, the greater areas of Toronto and Vancouver are expected to see the highest aggregate price increases at 11% and 10.5% respectively.

The Greater Toronto Area is the only region in Canada where condo price increases could overtake the rising costs of detached homes as the figure is forecast to go up by 12% year-over-year in 2022.

A report from the National Bank of Canada laid out how much money you need to be making to afford a house in cities across the country, with people in Toronto and Vancouver needing to earn over $200,000 annually and save for decades to get a house.

While it might not seem like it, a recent ranking actually found that Canada is one of the most affordable places in the world to buy a home.

After many months of home prices surging to never-before-seen highs, there’s no relief in sight for Toronto next year.

According to the new Housing Market Outlook from RE/MAX, home prices in the province’s capital are expected to rise another 10% in 2022. In larger markets like Toronto, the report says, there’s a chance that increased immigration next year will weigh on the already low supply levels and high home prices.

Interestingly, many of Ontario’s smaller markets are expected to have just as big, if not larger, price increases next year. Muskoka is projected to see prices rise by a whopping 20%; meanwhile, Thunder Bay and Collingwood/Georgian Bay are expected to have a 10% increase.

Durham, which saw a staggering 29% price increase year-over-year from 2020 to 2021, is projected to see a comparatively modest 7% increase in 2022. Brampton’s home prices, after a 25% year-over-year rise, are expected to go up 8% next year.

According to the report, inter-provincial migration will continue to be a key driver of housing activity in regions all across Canada.

“Less-dense cities and neighbourhoods offer buyers the prospect of greater affordability, along with liveability factors such as more space,” said Christopher Alexander, President of RE/MAX Canada. “In order for these regions to retain these appealing qualities and their relative market balance, housing supply needs to be added. Without more homes and in the face of rising demand, there’s potential for conditions in these regions to shift further.”

We knew it was coming. But it’s important and worth mentioning again. This week, Toronto City Council adopted new Zoning Bylaw Amendments that will remove most parking minimums across the city. We now join many other cities across North America who have done similar things in order to try and encourage more sustainable forms of mobility.

If you’d like to take a spin through the draft amendments, you’ll find them linked here. I haven’t gone through them in detail, but I did do a word search for “maximum” given that this week’s adoption represents a pretty clear change in perspective. Here’s an excerpt from the staff recommendation report that speaks to what I’m talking about:

Recognizing these challenges, this review of the parking standards in the city-wide Zoning By-law 569-2013 was guided by the principle that parking standards should allow only the maximum amount of automobile parking reasonably required for a given use and minimums should be avoided except where necessary to ensure equitable access. The previous review, which began in 2005, was guided by the principle that the zoning standards should require the minimum responsible amount of parking for a given land use. This is inconsistent with Official Plan policies which discourage auto dependence.


One other thing I found in the documents that went to Council was this map of parking spot selling prices in active high-rise developments across the city. Not surprisingly, downtown and midtown are showing the highest prices per parking space. I can’t vouch for the accuracy of all of these dots, but it looks directionally right and I can tell you that at least one of them is correct.

All of us in the industry know how much parking drives decision making. There’s a joke (half-joke) that when you’re designing a building, first you lay out the parking and then you design all of the residential suites around that structural grid. That’s not the way things should be done. The future of this city should not and cannot be centered around the car. This week’s adoption is in service of that.


Toronto home prices rose to a record as a sharp decline in the number of properties coming up for sale stoked competition among buyers, leaving little prospect the market will cool soon.

The average price of a home sold in the Toronto region in November was $1.16 million, up 22 per cent from last year. The number of new listings fell 13 per cent, according to data released Friday by the Toronto Regional Real Estate board.

Ultra-low mortgage rates, an open immigration policy and demand for larger living spaces in the pandemic have combined to created a homebuying frenzy that has made Canada one of the hottest housing markets in the world. Now, with the central bank signalling that interest rates could rise as early as April, buyers are finding incentives to try to get in the market now.

But there’s little to buy. There were about 6,100 active listings at the end of November — fewer than half the 13,800 on the market a year earlier.

The real estate board said that without policy measures, there won’t be enough new housing built to correct the supply-demand imbalance.

“Governments at all levels must take coordinated action to increase supply in the immediate term,” Kevin Crigger, president of the Toronto real estate board, said in a press release accompanying the data. “Unless governments work together to cut red tape, streamline the approval processes, and incentivize mid-density housing, ongoing housing affordability challenges will escalate.”

Though the cost of homes became an issue in the September election that returned Prime Minister Justin Trudeau to power, many of the levers that could increase the housing supply in Toronto and elsewhere lie with zoning and development rules controlled by local and provincial governments.

The drop in listings meant the total number of sales slipped 2.5 per cent on a seasonally adjusted basis from the month before. The average length of time a property stayed on the market was just 13 days. The data include the urban core of Toronto and its suburbs.

Sales of all types of ground-level homes registered fewer sales in November, but transactions for condominiums, which had gone out of favour last year after COVID-19 hit, surged 42 per cent as pickings among other property types grew slim and higher immigration flows bring the prospect of more potential tenants for units that are rented out.

Source: Bloomberg

The price of a new home in Canada increased on both a monthly and yearly basis during October as supply constraints persisted in some regions.

In its New Housing Price Index for October 2021, Statistics Canada reported that national new home prices grew by 0.9 per cent from September to October. This marks a slightly higher increase compared to the last four months, the federal department noted. On an annual basis, new home prices rose 11.5 per cent in October, a growth rate that has not been seen since 2006.

Out of the 27 census metropolitan areas (CMAs) analysed in the report, monthly prices increased in 15 of those communities, while 10 recorded no change and two CMAs saw prices drop. Year-to-year, prices were up in all 27 CMAs.

Kitchener–Cambridge–Waterloo in southeastern Ontario experienced the largest increase in new home prices, where values jumped by 3.8 per cent month-to-month. According to data from the Kitchener Waterloo Association of Realtors, the benchmark price for all residential properties was $803,900, up 2.5 per cent from September.

Similarly, London, Ont. saw new home prices increase 2.4 per cent from September to October, with the London St. Thomas Association of Realtors reporting a 2.9 per cent rise in the benchmark price for all residential properties to $613,900.

Compared to the other 27 CMAs, Kitchener–Cambridge–Waterloo also reported the largest annual price gains, with the cost of a new home climbing 29.2 per cent year-to-year.

“Given the proximity of the two cities to Toronto, demand for homes has also been coming from buyers outside the London and Kitchener–Cambridge–Waterloo region, driving home prices further up in a market with persisting low supply, and creating a barrier for some local buyers,” explained the StatsCan report.

On the opposite side of the country, Victoria, B.C saw monthly new home prices jump 3.3 per cent, the largest increase on record since May 2002. Active listings in the city diminished “due to sustained demand.” In October, there were 1,036 homes available for sale, 7.8 per cent fewer than the previous month according to the Victoria Real Estate Board.

“If competition for homes continues in Victoria, upward price pressure should persist given the historically low supply,” said the report.

By province, new home prices in Ontario, British Columbia and Quebec were up 1.2 per cent, 1.1 per cent and 0.2 per cent month-to-month. Alberta, Nova Scotia, Prince Edward Island and Newfoundland and Labrador reported no changes in new home prices during October.

Major provincial cities such as Toronto, Ottawa, Vancouver and Montreal saw monthly new home prices grow 1.3 per cent, 0.5 per cent, one per cent and 0.2 per cent from September to October.

In Toronto, you’re never very far from a crane. There are so many here — particularly because of the huge demand for new housing — that, in fact, we have more cranes than any other city on the continent, over 220 in the 416 alone. While our streets and our skylines are rapidly changing, there is always another raft of buildings waiting in line behind the scenes at City Hall for their approval. It can take years before the final approval, so here we look at a number of proposed new towers that may some day add to our growing urban canyons. Here’s our list of the top 10 tallest towers that are still awaiting their judgement days.

Let’s start our Top Ten at #14; 310 Front Street West. This mixed-use residential and office tower is currently under review after being submitted for Zoning By-Law Amendment (ZBA) in April of this year. If approved as planned, H&R REIT’s Hariri Pontarini Architects-designed building would stand 69-storeys/235.5 metres tall, and become home to 560 units. The tower could also have a landmark feature of strobe lights shooting out from its top level into the sky, making it hard to miss. They’re also the reason we snuck this one into our Top Ten list.

Now, into the actual Top Ten list, at #10; 372 Yonge. Designed by DIALOG for Yonge & Gerrard Partners Inc, Turbo-Mac Ltd, and Trimed Investments Inc, 372 Yonge was submitted to the City in July of 2020 for an Official Plan Amendment (OPA) and ZBA. The initial application was refused, but an updated proposal — located on the northwest corner of Yonge and Gerrard streets — was resubmitted, including for Site Plan Approval (SPA) in September. If approved, the building will stand 74-storeys/248 metres tall, and be home to a total of 415 residential units.

At #9 is 2180 Yonge. With multiple buildings designed variously by Pelli Clarke Pelli Architects, Hariri Pontarini Architects, and Adamson Associates for Oxford Properties Group, and CT REIT, 2180 Yonge was submitted to the City in December of 2020 for ZBA. The proposal includes five towers on the southwest corner of Yonge and Eglinton with a total of 2,701 residential units. The tallest building here is proposed at 70 storeys/253.5 metres.

At #8 is 475 Yonge. OPA and ZBA applications have been made to facilitate the redevelopment of the site for two BDP Quadrangle-designed towers for KingSett Capital. While the shorter 75-storey/246.4 metre tower would place at #11 this list, the taller 78-storey/255.25 metre tower on the northwest corner of Yonge and Wood streets puts the whole submission into the Top Ten. Documents were submitted in September and October of this year, and if approved, the towers would house 785 and 826 and residential units.

At #7 is 11 Bay. This proposed development — designed by Daoust Lestage Architecture and Hariri Pontarini Architects for QuadReal Property Group and Barney River — is to be an integrated 54-storey/269.45 metre office tower with retail and a conference facility, located at the prime intersection of Bay Street and Queens Quay. It is currently awaiting ZBA approval from the City, which was applied for in September of 2020.

At #6 is Chelsea Green. This site has ZBA approval, but awaits the Planning department’s go-ahead on the SPA for the proposal. The tallest building here is an 86-storey/283.53 metre-tall condo designed by architects—Alliance for Great Eagle Holdings on the southwest corner of Gerrard Street West and Yonge Street. Along with residential use, other buildings on the site include a hotel, office space, and retail, while a new park is also proposed for part of the property.

At #5 is Union Centre. Designed by the renowned Bjarke Ingels Group for Westbank Corp and Allied Properties REIT, Union Centre had its OPA and ZBA applications approved by the City last month, but still awaits ratification by the OLT. Union Centre’s SPA remains under review by the City. If built as planned, the building will stand 54-storeys/298.00 metres tall, and be home to 1.7 million ft² of office space at Simcoe and Station streets, and be topped by a terraced green roof.

At #4 is Union Park. Designed by Pelli Clarke Pelli Architects and Adamson Associates Architects for Oxford Properties Group, the developer applied for ZBA in August of 2019, and is still waiting on a decision from the City. If approved as proposed, the development would consist of four towers, two residential towers and two office towers, the tallest of which would be a 58-storey/303.26 metre-tall office tower. At over 300 metres, it would be considered a “supertall.”

At #3 is the taller tower at Gehry Towers. Designed by the renowned Gehry Partners with Toronto’s BDP Quadrangle, the project is being developed by Great Gulf, Dream Unlimited, and Westdale Properties. Originally proposed as Mirvish+Gehry by Projectcore, applications to the City for ZPA and SPA were submitted in 2012 and 2016, respectively. Changes meant that the ZBA was reapplied for in 2014, and that received approval. Further changes, however, meant another resubmission in 2018, and a revised version of it remains under review. A revised SPA also awaits approval. Once this development gets the go-ahead, the two towers would stand at 84 and 74-storeys (308 and 266.5 metres) on the block bordered by King, Pearl, Ed Mirvish Way and John Street, and house a respective 1170 and 868 residential units, with retail, office, and institutional space in the podiums. The taller building would be another supertall.

At #2 is 212 King Street West. It is a proposed 80-storey/311.8 metre mixed-use building designed by SHoP Architects for Dream Office REIT and Humbold Properties, on the northwest corner of King Street West and Simcoe Street in the heart of Downtown. The developers submitted applications for ZBA in December of 2020, and for SPA in June of this year. Both applications are currently under review. If approved as planned, the supertall building would house a total of 588 office and rental units.

Way up at the top at #1 is the incredibly skinny 1200 Bay. Designed by Swiss starchitects Herzog & de Meuron Architekten with Toronto architects BDP Quadrangle for ProWinko and Kroonenberg Group, this proposal is an 87-storey/324 metre mixed-use building that would house total of 332 residential suites across 71 floors, with 13 floors of office space and two floors of retail closer to ground level. A restaurant would sit up at the very top. Applied for in June of 2020, 1200 Bay awaits a decision from the City on its ZBA application.

A final note to add would be to include a building that is — unlike any of the other buildings in this list — actually already under construction. The One, an 85-storey mixed-use condo/hotel/retail tower on the southwest corner of Yonge and Bloor streets, is approved at 308.6 metres tall, and should be Toronto’s and Canada’s first building to achieve supertall status… but Mizrahi Developments have applied for approval to extend the height of this Foster + Partners and Core Architects designed building to 338.3 metres. Even with it belonging on a Top Ten Under Construction list, that potential extension to 94 storeys makes The One the actual #1 on this list too, bumping all the proposals on the list down by one.