Since the end of April, we have heard many reports on how the [Toronto-Condo-Market-May-2017-New-Legislature-Effect-Toronto-Condo-Market-]Ontario Fair Housing Plan has changed the face of Toronto’s real estate market. We have heard diverse reports ranging from dire as the market has stalled and prices have dropped dramatically, to reports that there has been little impact on the Toronto market other than fewer sales.
I am going to dedicate myself to assist you in sorting out what effect the new legislature has had on the industry. I will not just give you blanket statements like we are hearing from Toronto’s media but focus on each downtown and midtown Toronto condo neighbourhoods so you may be able to see the changes based on the actual sales that have occurred in each area.
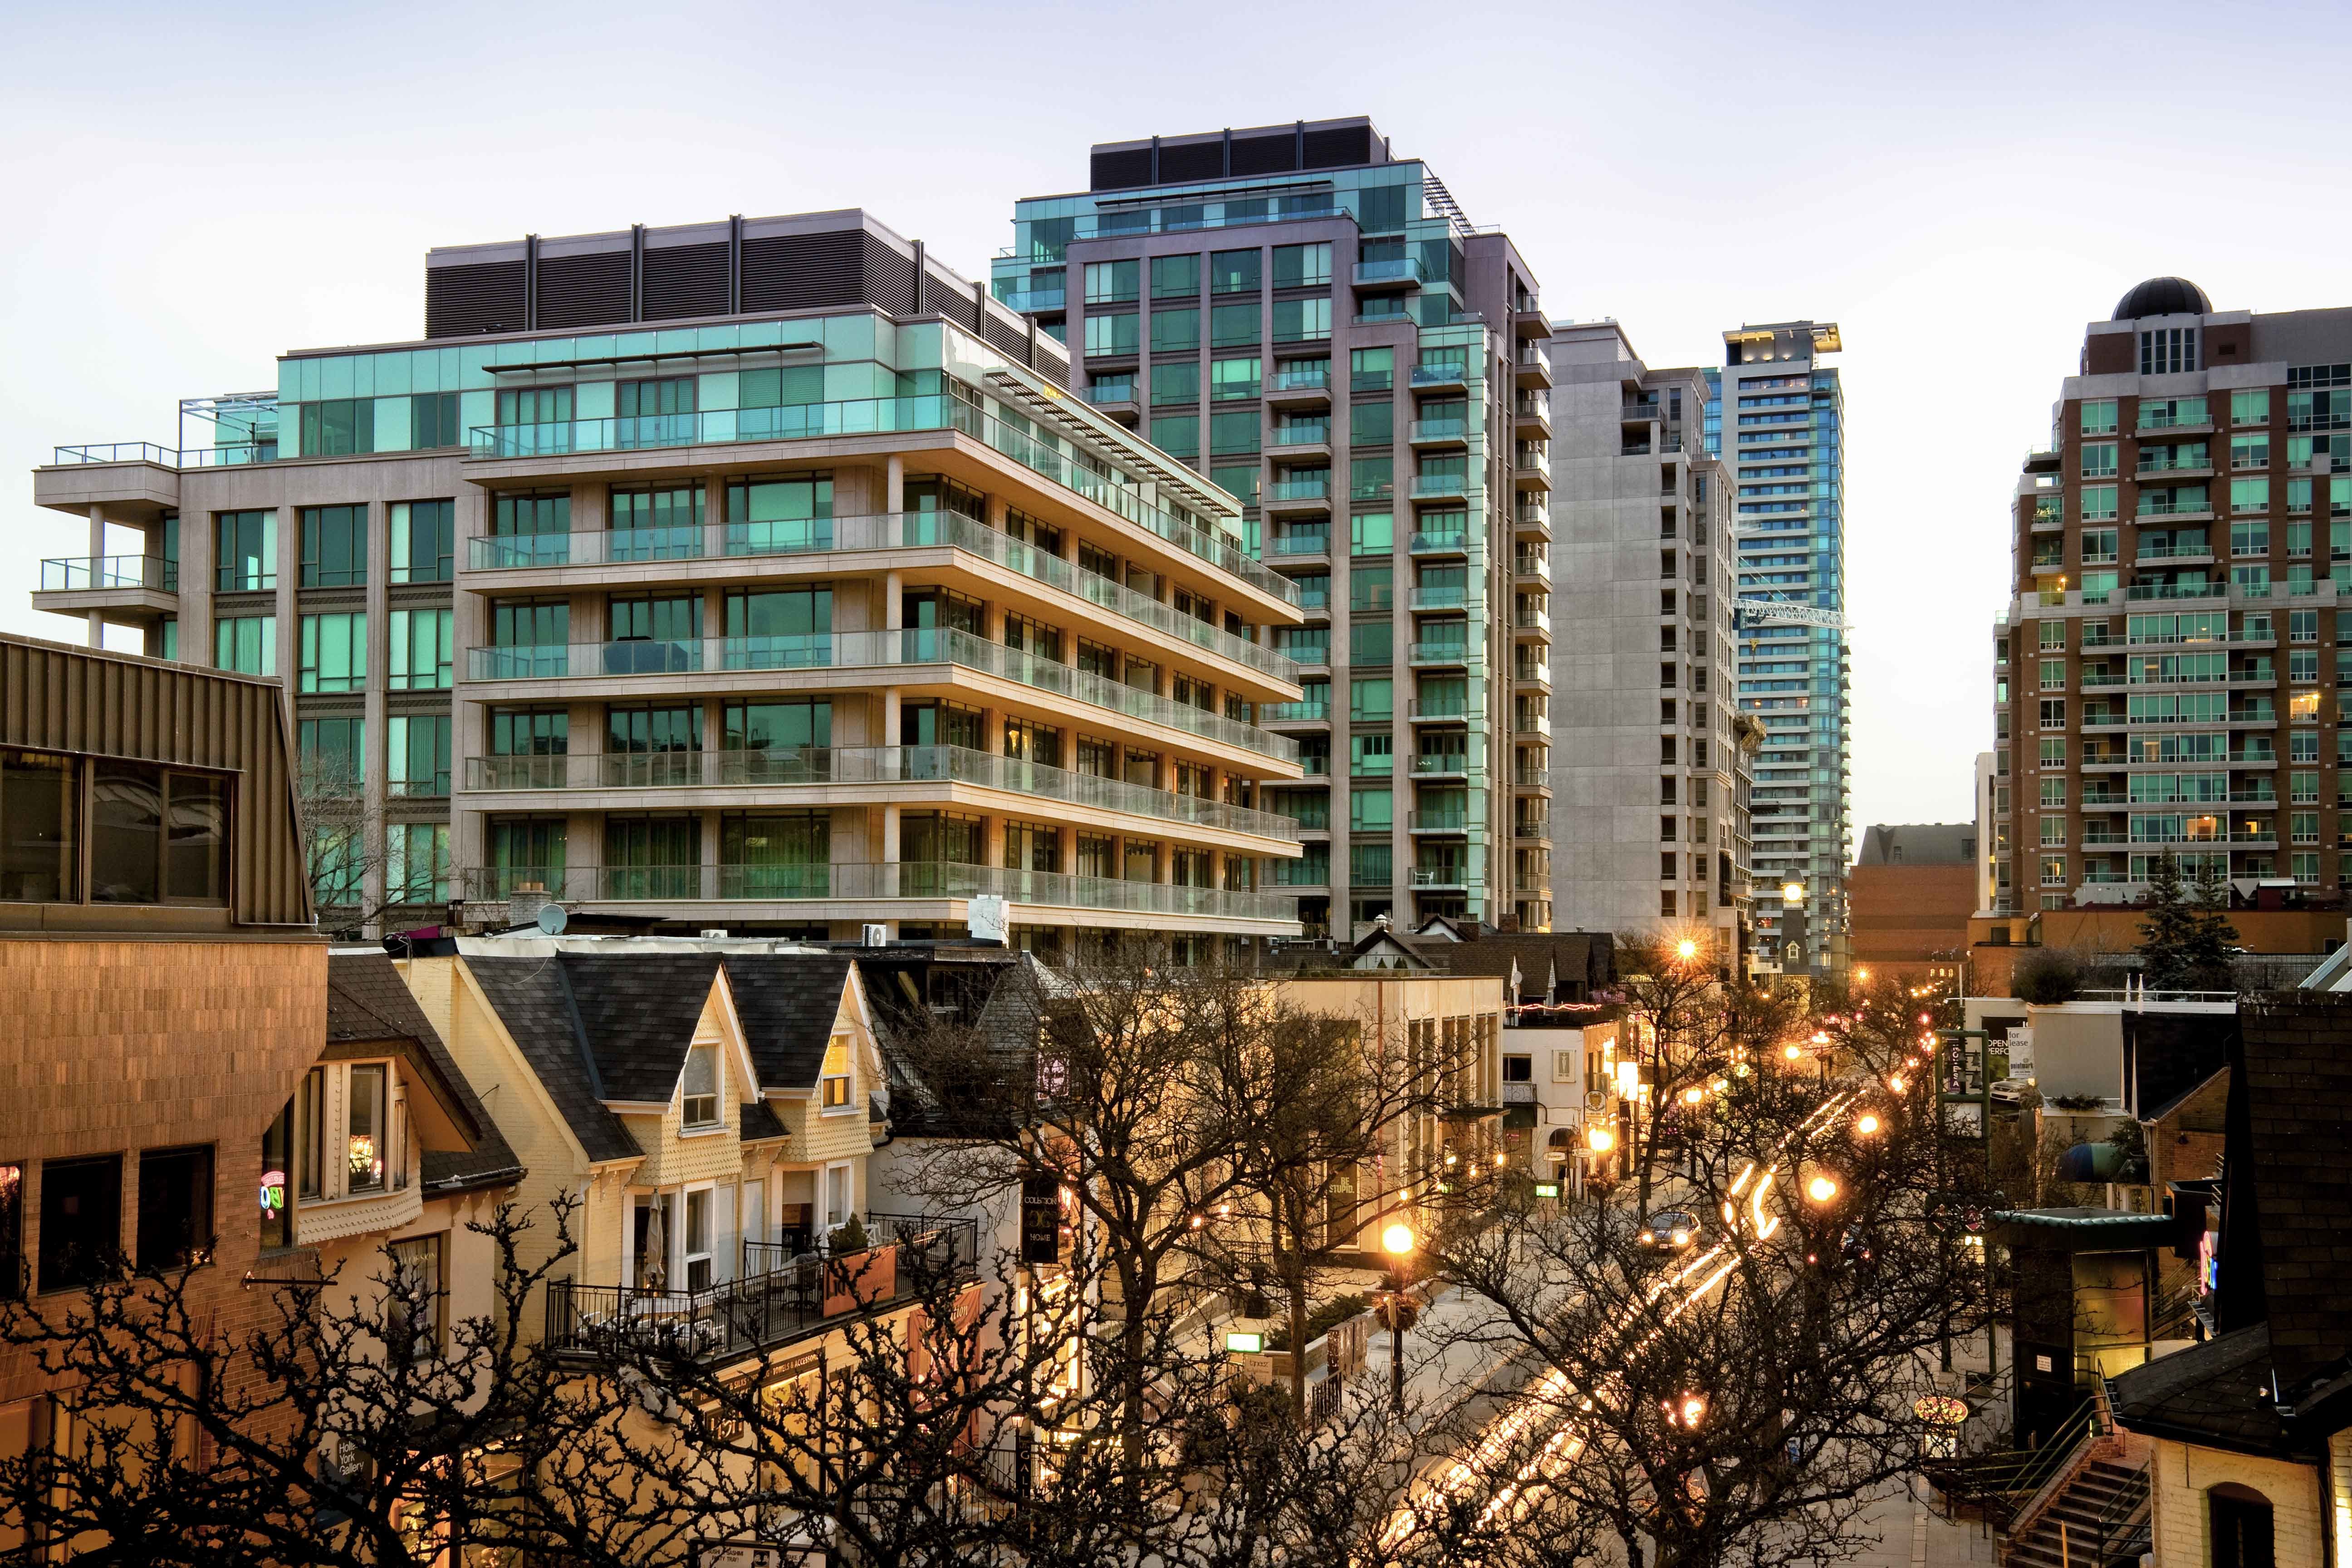
The first neighbourhood I will attack is [4a_custpage_109146.html]Yorkville in Downtown, Toronto around the Yonge, Avenue Road and Bloor area. This neighbourhood tends to has higher-end buildings and has been the most expensive condo area in Toronto.
I will breakdown by month beginning with March 21 – April 20 (the month prior to the changes) and moving through the 1st three months of the changes, as well as comparing with the year prior. We will explore the effects in both sales and prices and compare each category so you may see the real picture for this neighbourhood.
If you find this information useful, look for Bay Street Corridor Report next week. In the next few weeks, I will cover all of the downtown areas to give you true numbers for those looking to buy and sell. I think it is critical for all those who are interested in Toronto real estate, including real estate agents and brokers, to understand the changes and how it has affected the market. In fact, I am working towards reporting all this information by building because we are already seeing changes that are unique to each condo building.
It has been very interesting to look at the Yorkville, Annex, Toronto numbers. There has definitely been a decline in the number of sales over this period of time. In 2016 we saw the number of sales in the mid 30’s each month and this was the case prior to the change. However, from May 21st to June 20th there were 24 condo sales in the Annex, from June 21st to July 20th there were 19 sales and July 21st to August 20th there were 28 sales. What I find interesting is that the sales prices have actually increased on average.
The average sales price from March 21st through April 20th (prior to the rule change) was $1,174,126. The first month after the changes (April 21st to May 20th) we saw an increase of 7%, to $1,260,720. The second month (May 21st to June 20th) we saw a decrease in sales price to $1,055,403 but the market rebounded quickly in the 3rd month (June 21st to July 20th) to $2,091,889, an increase of 76%. The month showed a significantly higher increase, but it must be taken into consideration that there were 3 very expensive sales.
July 21st through August 20th saw the average sales price drop back, to $1,058,604, which I consider closer to the norm. However, it is still up by more than 10% over the same period in 2016.
Prior to the change on April 21st, the price per square foot was $959.02 and we have seen this rise to as much as $1,038. In July-August we saw this figure remain strong at $1,019 per square foot. This is still a 6% increase over the March/April numbers.
Yorkville has remained a very strong market even after the changes. The numbers that truly supports the strength of the market is the average price per square foot and fewer listings. You can have a few high end deals that boost your sales price numbers but the price per square foot will always remain relevant. Over the past 5 months we have seen a rise in this number by as much as 8%.
For those who have been reluctant to sell their Yorkville condo due to what is being reported in the media, now is a great time to sell a Yorkville condos… it is still a strong sellers market!
|
|
July 21 – August 20, 2017
|
|
June 21 – July 20, 2017
|
|
May 21 – June 20 2017
|
|
Apr. 21 – May 20, 2017
|
|
Mar 21 – Apr. 20 2017
|
|
# of Sales
|
28
|
|
19
|
|
24
|
|
35
|
|
38
|
|
Ave. Listing Price
|
$1,066,292
|
|
$2,256,294
|
|
$1,055,403
|
|
$1,260,720
|
|
$1,174,126
|
|
Ave. Sales Price
|
$1,058,604 (-11%) since change
|
|
$2,091,889 (+25%) since change
|
|
$1,058,571 (-11%) since change
|
|
$1,254,492
|
|
$1,188,827
|
|
Aprox Ave $ per sq. ft.
|
$1,019.10 (+6%) since change
|
|
$1,039.94 (+8%) since change
|
|
$928.11 (-3%) since change
|
|
$993.48
|
|
$959.02
|
|
% of Sold to Listing Price
|
99%
|
|
93%
|
|
103 %
|
|
99%
|
|
101%
|
|
|
July 21 – August 20, 2016
|
|
June 21 – July 20, 2016
|
|
May 21 – June 20 2016
|
|
Apr. 21 – May 20, 2016
|
|
Mar 21 – Apr. 20 2016
|
|
# of Sales
|
24
|
|
32
|
|
33
|
|
31
|
|
39
|
|
Ave. Listing Price
|
$980,762
|
|
$916,284
|
|
$921,586
|
|
$856,516
|
|
$793,387
|
|
Ave. Sales Price
|
$959,661
|
|
$891,469
|
|
$894,784
|
|
$840,425
|
|
$789,891
|
|
Aprox Ave $ per sq. ft.
|
$817.07
|
|
$736.02
|
|
$742.67
|
|
$600.76
|
|
$717.34
|
|
% of Sold to Listing Price
|
98%
|
|
97%
|
|
97%
|
|
98%
|
|
106%
|
|
|
|
|
|
|
|
|
|
|
|
|
July 21 – Aug. 20 2017
|
|
|
|
|
# of Suites
|
|
Ave Sales Price
|
|
Aprox. Price per Square foot
|
|
Studios / Bachs
|
|
|
|
|
1
|
|
$399,999
|
|
$690.84
|
|
1 Bedrooms
|
|
|
|
|
9
|
|
$596,889
|
|
$954.41
|
|
1 Bdrm + Den
|
|
|
|
|
6
|
|
$689,483
|
|
$960.61
|
|
2 Bedrooms
|
|
|
|
|
6
|
|
$762,833
|
|
$913.12
|
|
2 Bdrm + Den
|
|
|
|
|
4
|
|
$2,898,750
|
|
$1,547.16
|
|
3 Bedrooms
|
|
|
|
|
2
|
|
$1,780,000
|
|
$911.64
|
|
3 + 1 Bdrm
|
|
|
|
|
–
|
|
–
|
|
–
|
|
4 Bedroom
|
|
|
|
|
–
|
|
–
|
|
–
|
|
|
|
|
|
|
|
|
|
|
|
|
June 21 – July 20 2017
|
|
|
|
|
# of Suites
|
|
Ave Sales Price
|
|
Aprox. Price per Square foot
|
|
Studios / Bachs
|
|
|
|
|
0
|
|
–
|
|
–
|
|
1 Bedrooms
|
|
|
|
|
5
|
|
$563,980
|
|
$906.67
|
|
1 Bdrm + Den
|
|
|
|
|
4
|
|
$580,000
|
|
$956.67
|
|
2 Bedrooms
|
|
|
|
|
3
|
|
$843,667
|
|
$772.23
|
|
2 Bdrm + Den
|
|
|
|
|
2
|
|
$3,177,500
|
|
$1,403.70
|
|
3 Bedrooms
|
|
|
|
|
3
|
|
$2,948,333
|
|
$1,101.71
|
|
3 + 1 Bdrm
|
|
|
|
|
0
|
|
–
|
|
–
|
|
4 Bedroom
|
|
|
|
|
2
|
|
$8,437,500
|
|
$2,969.56
|
|
|
|
|
|
|
|
|
|
|
|
|
May 21 – June 20 2017
|
|
|
|
|
# of Suites
|
|
Ave Sales Price
|
|
Aprox. Price per Square foot
|
|
Studios / Bachs
|
|
|
|
|
0
|
|
–
|
|
–
|
|
1 Bedrooms
|
|
|
|
|
9
|
|
$761,296
|
|
$997.19
|
|
1 Bdrm + Den
|
|
|
|
|
7
|
|
$689,514
|
|
$834.14
|
|
2 Bedrooms
|
|
|
|
|
12
|
|
$1,247,500
|
|
$986.56
|
|
2 Bdrm + Den
|
|
|
|
|
6
|
|
$1,616,666
|
|
$1,120.87
|
|
3 Bedrooms
|
|
|
|
|
3
|
|
$1,541,166
|
|
$1,196.87
|
|
3 + 1 Bdrm
|
|
|
|
|
0
|
|
–
|
|
–
|


 Maziar Moini, Broker of Record - Home Leader Realty Inc.
300 Richmond St. W., #300, Toronto, ON M5V-1X2
Maziar Moini, Broker of Record - Home Leader Realty Inc.
300 Richmond St. W., #300, Toronto, ON M5V-1X2